
Published Apr 10, 2025
Heartbeat & Oxygen Monitor Solution
Track heart rate and oxygen saturation in real time with dual-sensor integration and live chart visualization
What you'll learn and build
Intro
The Heartbeat & Oxygen Monitor solution integrates Heart Rate 13 Click and Oximeter 5 Click to enable simultaneous real-time monitoring of heart rate and blood oxygen saturation (SpO₂). Designed for personal health tracking, fitness monitoring, and wellness applications, this solution uses pulse and infrared sensors to accurately capture physiological data and display it through NECTO Studio’s Plot tool for real-time visualization. By providing clear, separate charts for heart rate and SpO₂, it offers an intuitive and effective approach to vital sign tracking in modern health tech applications.
mikroBUS 1
Heart Rate 13 Click
Heart Rate 13 Click is a compact add-on board for precise and reliable vital sign monitoring. This board features the SFH 7074, a biomonitoring sensor from ams OSRAM, with signal processing handled by the ADPD1080 photometric front-end from Analog Devices. The SFH 7074 is optimized for photoplethysmography (PPG) applications, featuring a strong optical signal, an integrated light barrier to prevent crosstalk and high ESD protection. The ADPD1080 ensures accurate signal conversion with a 14-bit ADC and built-in interference rejection, enabling stable measurements even under ambient light conditions. Communication with the host MCU is established via an I2C interface, with additional I/O pins for interrupts and clocking options. Heart Rate 13 Click is ideal for wearable health devices, fitness trackers, and medical diagnostic applications, where real-time biometric data is essential for monitoring heart rate, oxygen saturation, and other vital signs.

mikroBUS 2
Oximeter 5 Click
Oximeter 5 Click is a compact add-on board suitable for measuring blood oxygen saturation. This board features the MAX30102, integrated pulse oximetry, and heart-rate monitor module from Analog Devices. The MAX30102 includes internal LEDs, photodetectors, optical elements, and low-noise electronics with ambient light rejection. It operates on a single 1.8V power supply acquired from both mikroBUS™ power rails for the internal LEDs, communicating through a standard I2C compatible interface. The MAX30102 can be shut down through software with zero standby current, allowing the power rails to remain powered at all times. This Click board™ makes it an excellent choice for optical pulse oximetry and health monitoring applications.

Features overview
Development board
Clicker 4 for STM32F4 is a compact development board designed for quickly building custom gadgets. It features an STM32F407VGT6 MCU, four mikroBUS™ sockets for Click board™ connectivity, power management, and more—making it ideal for rapid application development. At its core, the STM32F407VGT6 MCU, powered by an Arm® Cortex®-M4 32-bit processor running up to 168 MHz, ensures ample processing power for demanding tasks. Alongside two 1x20 pin headers, its four mikroBUS™ sockets provide access to a vast and growing range of Click boards™. Clearly marked sections offer an intuitive, user-friendly interface for faster development. Clicker 4 not only accelerates prototyping but can also be integrated directly into projects without additional hardware modifications. Four 4.2mm (0.165”) mounting holes at each corner enable easy installation with screws.

Microcontroller Overview
MCU Card / MCU
Architecture
ARM Cortex-M4
MCU Memory (KB)
10
Silicon Vendor
STMicroelectronics
Pin count
100
RAM (Bytes)
100
Step by step
Project assembly
Start by selecting your development board - Clicker 4 for STM32F4


Track your results in real time
Application Output
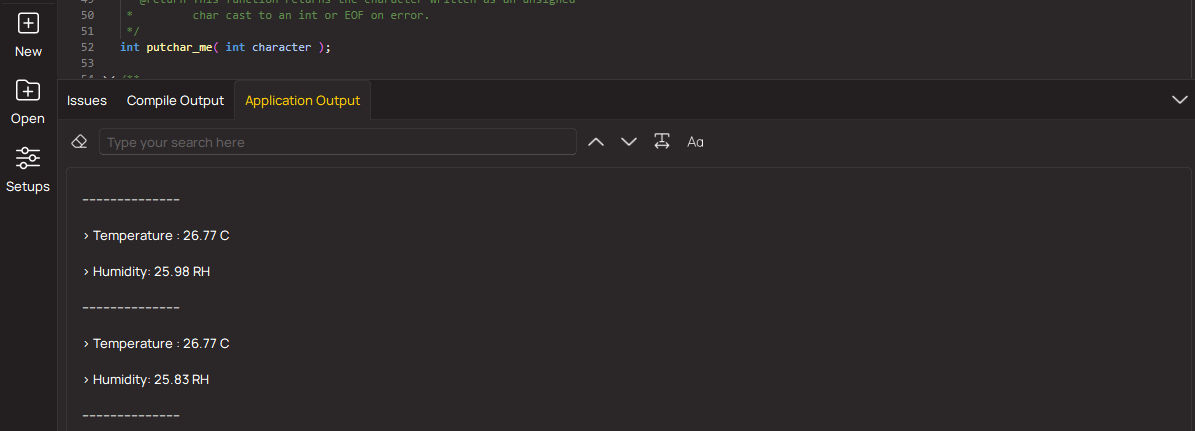
1. Application Output - In Debug mode, the 'Application Output' window enables real-time data monitoring, offering direct insight into execution results. Ensure proper data display by configuring the environment correctly using the provided tutorial.
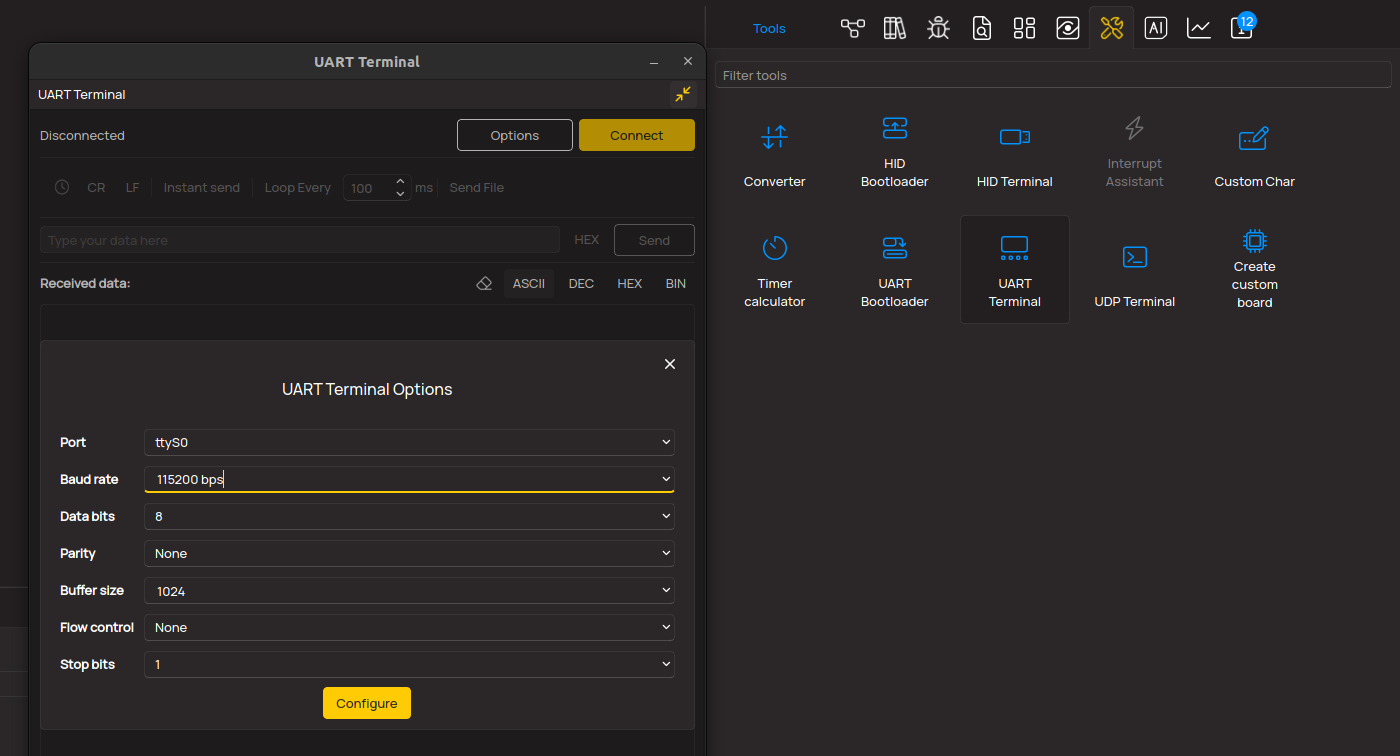
2. UART Terminal - Use the UART Terminal to monitor data transmission via a USB to UART converter, allowing direct communication between the Click board™ and your development system. Configure the baud rate and other serial settings according to your project's requirements to ensure proper functionality. For step-by-step setup instructions, refer to the provided tutorial.
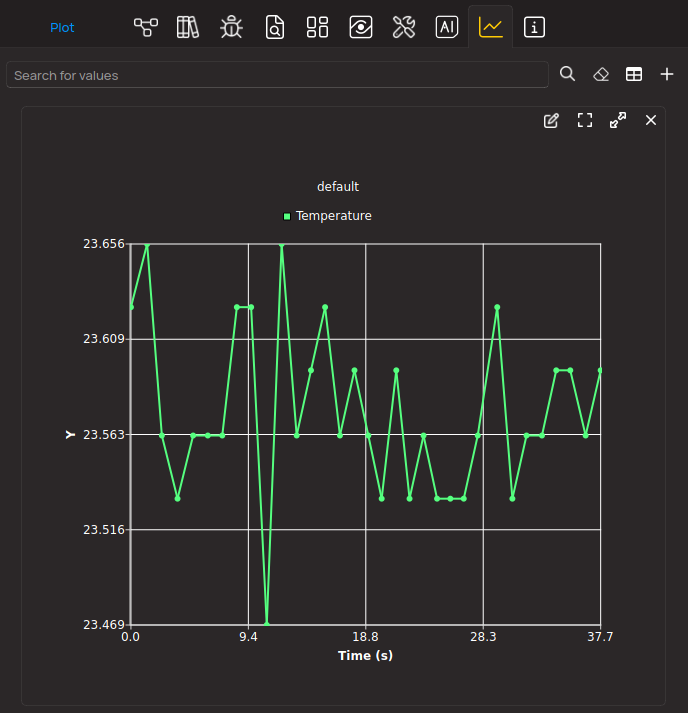
3. Plot Output - The Plot feature offers a powerful way to visualize real-time sensor data, enabling trend analysis, debugging, and comparison of multiple data points. To set it up correctly, follow the provided tutorial, which includes a step-by-step example of using the Plot feature to display Click board™ readings. To use the Plot feature in your code, use the function: plot(*insert_graph_name*, variable_name);. This is a general format, and it is up to the user to replace 'insert_graph_name' with the actual graph name and 'variable_name' with the parameter to be displayed.
Software Support
Library Description
Heartbeat & Oxygen Monitor Solution is developed using the NECTO Studio, ensuring compatibility with mikroSDK's open-source libraries and tools. Designed for plug-and-play implementation and testing, this solution is fully compatible with all development, starter, and mikromedia boards featuring a mikroBUS™ socket.
Example Description
The Heartbeat & Oxygen Monitor solution integrates Heart Rate 13 Click and Oximeter 5 Click to measure heart rate and blood oxygen saturation (SpO2). The Heart Rate 13 Click provides heart rate measurements by detecting pulse through its sensor, while the Oximeter 5 Click measures blood oxygen levels using an infrared light-based sensor. The collected data is visualized on the NECTO Studio's Plot tool, where the heart rate and SpO2 values are displayed on separate charts for clear distinction. The solution is ideal for applications in health monitoring, wellness tracking, and fitness devices.
Key functions:
heartrate13_init- Initializes the Heart Rate 13 Click for heart rate measurement.heartrate13_default_cfg- Configures the Heart Rate 13 Click with default settings for heart rate detection.heartrate13_get_pd_data- Retrieves the pulse data (heart rate) from the Heart Rate 13 Click.oximeter5_init- Initializes the Oximeter 5 Click for SpO2 measurement.oximeter5_default_cfg- Configures the Oximeter 5 Click with default settings for SpO2 and pulse oximetry data collection.oximeter5_get_oxygen_saturation- Retrieves the SpO2 value from the Oximeter 5 Click based on the sensor data.oximeter5_check_interrupt- Checks for interrupt signals indicating that new data is available for reading from the Oximeter 5 Click.plot- Displays the heart rate and SpO2 values on the Plot application for real-time visualization.
Application Init
The initialization sequence configures the system for heart rate and SpO2 monitoring:
1. The UART logger is initialized for debugging.
2. The Heart Rate 13 Click is set up for heart rate measurement.
3. The Oximeter 5 Click is initialized for SpO2 measurement.
4. The buffers for sensor data collection are prepared, and initial readings are taken to ensure proper operation.
If any initialization step fails, the system logs an error and halts to prevent undefined behavior.
Application Task
The main loop performs the following operations:
1. Waits for data from both the Heart Rate 13 Click and Oximeter 5 Click.
2. Reads the heart rate from the Heart Rate 13 Click and SpO2 from the Oximeter 5 Click.
3. Visualizes heart rate on one chart and SpO2 on another in the Plot tool.
4. Waits for the user to place a finger on the respective sensor for data acquisition.
5. Updates the charts with the latest measurements.
6. Repeats the process, continuously monitoring the heart rate and SpO2 values for real-time tracking.
Open Source
Code example
The complete application code and a ready-to-use project are available through the NECTO Studio Package Manager for direct installation in the NECTO Studio. The application code can also be found on the MIKROE GitHub account.
/*!
 * Solution Name: Heartbeat & Oxygen Monitor
 *
 * # Description
 * This example demonstrates the use of Heart Rate 13 Click and
 * Oximeter 5 Click boards for measuring heart rate and SpO2 values,
 * which can be visualized on the Plot application.
 *
 * The demo application is composed of three sections:
 *
 * ## Application Init
 * Initializes the drivers for both the Heart Rate 13 Click and
 * Oximeter 5 Click, performs the default configurations for heart rate
 * and SpO2 measurements, and prepares the necessary buffers for data
 * acquisition.
 *
 * ## Application Task
 * The task waits for data from both Click boards, then reads the
 * heart rate and SpO2 measurements, and displays them on the Plot
 * tool. The user can visualize heart rate on one chart and SpO2 on another
 * chart after creating separate charts within Plot. The heart rate
 * data is visualized upon placing a finger on the Heart Rate 13 Click's
 * sensor, and the SpO2 data is visualized by placing
 * a finger on the Oximeter 5 Click's sensor.
 *
 * ## Plot Functionality
 * To visualize the data:
 * 1. Run the debug feature by pressing F9 on the keyboard.
 * 2. Navigate to the Plot feature by pressing `CTRL` + `F9`.
 * 3. Press F6 to start the application.
 * 4. First, place a finger on the Heart Rate 13 Click`s sensor to visualize
 *    the heart rate on the plot.
 * 5. Next, place a finger on the Oximeter 5 Click`s sensor to visualize
 *    the SpO2 value on the plot.
 *    Create a new chart by selecting the 'Create separate charts' option
 *    in Plot to see both heart rate and SpO2 values on distinct charts.
 *
 * @note
 * It is important to create separate charts for the heart rate and SpO2
 * measurements in the Plot tool to clearly distinguish between
 * the two readings.
 *
 * Author: Branko Jaksic
 * Date: April, 2025
 *
 */

// ------------------------------------------------------------------- INCLUDES
#include "log.h"
#include "board.h"
#include "oximeter5.h"
#include "heartrate13.h"

// ------------------------------------------------------------------ VARIABLES
static log_t logger;
static oximeter5_t oximeter5;
static heartrate13_t heartrate13;

// Oximeter 5 Click variables
static uint32_t aun_ir_buffer[ 100 ];
static uint32_t aun_red_buffer[ 100 ];
static uint32_t un_min, un_max, un_prev_data, un_brightness;
static float f_temp;
static uint8_t n_spo2;

// ------------------------------------------------------ APPLICATION FUNCTIONS
void application_init ( void )
{
    log_cfg_t log_cfg;  /**< Logger config object. */
    heartrate13_cfg_t heartrate13_cfg;  /**< Click config object. */
    oximeter5_cfg_t oximeter5_cfg;  /**< Click config object. */

    /**
     * Logger initialization.
     * Default baud rate: 115200
     * Default log level: LOG_LEVEL_DEBUG
     * @note If USB_UART_RX and USB_UART_TX
     * are defined as HAL_PIN_NC, you will
     * need to define them manually for log to work.
     * See @b LOG_MAP_USB_UART macro definition for detailed explanation.
     */
    LOG_MAP_USB_UART( log_cfg );
    log_init( &logger, &log_cfg );
    log_info( &logger, " Application Init " );

    // Heart Rate 13 Click initialization.
    heartrate13_cfg_setup( &heartrate13_cfg );
    HEARTRATE13_MAP_MIKROBUS( heartrate13_cfg, MIKROBUS_1 );
    if ( I2C_MASTER_ERROR == heartrate13_init( &heartrate13,
                                               &heartrate13_cfg ) )
    {
        log_error( &logger, " Communication init." );
        for ( ; ; );
    }

    if ( HEARTRATE13_ERROR == heartrate13_default_cfg ( &heartrate13 ) )
    {
        log_error( &logger, " Default configuration." );
        for ( ; ; );
    }

    // Oximeter 5 Click initialization.
    oximeter5_cfg_setup( &oximeter5_cfg );
    OXIMETER5_MAP_MIKROBUS( oximeter5_cfg, MIKROBUS_2 );
    if ( I2C_MASTER_ERROR == oximeter5_init( &oximeter5, &oximeter5_cfg ) )
    {
        log_error( &logger, " Communication init." );
        for ( ; ; );
    }
    Delay_ms ( 100 );

    if ( OXIMETER5_ERROR == oximeter5_default_cfg ( &oximeter5 ) )
    {
        log_error( &logger, " Default configuration." );
        for ( ; ; );
    }
    Delay_ms ( 100 );

    un_brightness = 0;
    un_min = 0x3FFFF;
    un_max = 0;

    for ( uint8_t n_cnt = 0; n_cnt < 100; n_cnt++ )
    {
        while ( oximeter5_check_interrupt( &oximeter5 ) == OXIMETER5_INTERRUPT_ACTIVE );

        oximeter5_read_sensor_data( &oximeter5,
                                    &aun_red_buffer[ n_cnt ],
                                    &aun_ir_buffer[ n_cnt ] );

        if ( un_min > aun_red_buffer[ n_cnt ] )
        {
            un_min = aun_red_buffer[ n_cnt ];
        }

        if ( un_max < aun_red_buffer[ n_cnt ] )
        {
            un_max = aun_red_buffer[ n_cnt ];
        }
    }

    oximeter5_get_oxygen_saturation( &aun_ir_buffer[ 0 ], 100,
                                     &aun_red_buffer[ 0 ], &n_spo2 );
    log_info( &logger, " Application Task " );
    Delay_ms ( 100 );
}

void application_task ( void )
{
    heartrate13_pd_data_t pd_data;

    // Switch I2C communication to Heart rate 13 Click.
    i2c_master_set_slave_address(&heartrate13.i2c, heartrate13.slave_address);

    if ( HEARTRATE13_OK == heartrate13_get_pd_data ( &heartrate13, &pd_data ) )
    {
        log_printf ( &logger, "%u\r\n", pd_data.pd3 );
        plot("HEART RATE: ", pd_data.pd3);
    }

    // Switch I2C communication to Oximeter 5 Click.
    i2c_master_set_slave_address(&oximeter5.i2c, oximeter5.slave_address);

    for ( uint8_t n_cnt = 25; n_cnt < 100; n_cnt++ )
    {
        aun_red_buffer[ n_cnt - 25 ] = aun_red_buffer[ n_cnt ];
        aun_ir_buffer[ n_cnt - 25 ] = aun_ir_buffer[ n_cnt ];

        if ( un_min > aun_red_buffer[ n_cnt ] )
        {
            un_min = aun_red_buffer[ n_cnt ];
        }

        if ( un_max < aun_red_buffer[ n_cnt ] )
        {
            un_max=aun_red_buffer[n_cnt];
        }
    }

    for ( uint8_t n_cnt = 75; n_cnt < 100; n_cnt++ )
    {
        un_prev_data = aun_red_buffer[ n_cnt - 1 ];
        while ( oximeter5_check_interrupt( &oximeter5 ) == OXIMETER5_INTERRUPT_ACTIVE );

        oximeter5_read_sensor_data( &oximeter5,
                                    &aun_red_buffer[ n_cnt ],
                                    &aun_ir_buffer[ n_cnt ] );

        if ( aun_red_buffer[ n_cnt ] > un_prev_data )
        {
            f_temp = aun_red_buffer[ n_cnt ]-un_prev_data;
            f_temp /= ( un_max - un_min );
            f_temp *= MAX_BRIGHTNESS;
            f_temp = un_brightness - f_temp;

            if ( f_temp < 0 )
            {
                un_brightness = 0;
            }
            else
            {
                un_brightness = ( uint32_t ) f_temp;
            }
        }
        else
        {
            f_temp = un_prev_data - aun_red_buffer[ n_cnt ];
            f_temp /= ( un_max - un_min );
            f_temp *= MAX_BRIGHTNESS;
            un_brightness += ( uint32_t ) f_temp;

            if ( un_brightness > MAX_BRIGHTNESS )
            {
                un_brightness = MAX_BRIGHTNESS;
            }
        }

        if ( ( OXIMETER5_OK == oximeter5_get_oxygen_saturation( &aun_ir_buffer[ 0 ],
                                                                100,
                                                                &aun_red_buffer[ 0 ],
                                                                &n_spo2 ) ) )
        {
            if ( aun_ir_buffer[n_cnt] > 10000  )
            {
                log_printf( &logger, "\tIR    : %lu \r\n", aun_ir_buffer[ n_cnt ] );
                log_printf( &logger, "\tRED   : %lu \r\n", aun_red_buffer[ n_cnt ] );
                log_printf( &logger, "- - - - - - - - - - - - - - -\r\n" );
                log_printf( &logger, "\tSPO2  : %d %%\r\n", ( uint16_t ) n_spo2 );
                log_printf( &logger, "-----------------------------\r\n" );
                plot("SpO2 (0% - 100%): ", ( uint16_t ) n_spo2 );
                Delay_ms ( 100 );
            }
            else
            {
                Delay_ms ( 10 );
            }
        }
    }
}

int main ( void )
{
    /* Do not remove this line or clock might not be set correctly. */
    #ifdef PREINIT_SUPPORTED
    preinit();
    #endif

    application_init( );

    for ( ; ; )
    {
        application_task( );
    }

    return 0;
}

// ------------------------------------------------------------------------ END
Additional Support
Resources
Category:Consumer Healthcare Devices