Verify your connections easily and save valuable time during the debugging phase using PIC32MZ2048EFM100
Effortless diagnostics: The ultimate tool for logic level confirmation

Published Oct 14, 2023
Click board™
Tester Click
Dev. board
Curiosity PIC32 MZ EF
Compiler
NECTO Studio
MCU
PIC32MZ2048EFM100
Our mission is to empower developers with a convenient and user-friendly diagnostic tool that simplifies the hardware testing process, ensuring a smoother development journey
A
A
Hardware Overview
How does it work?
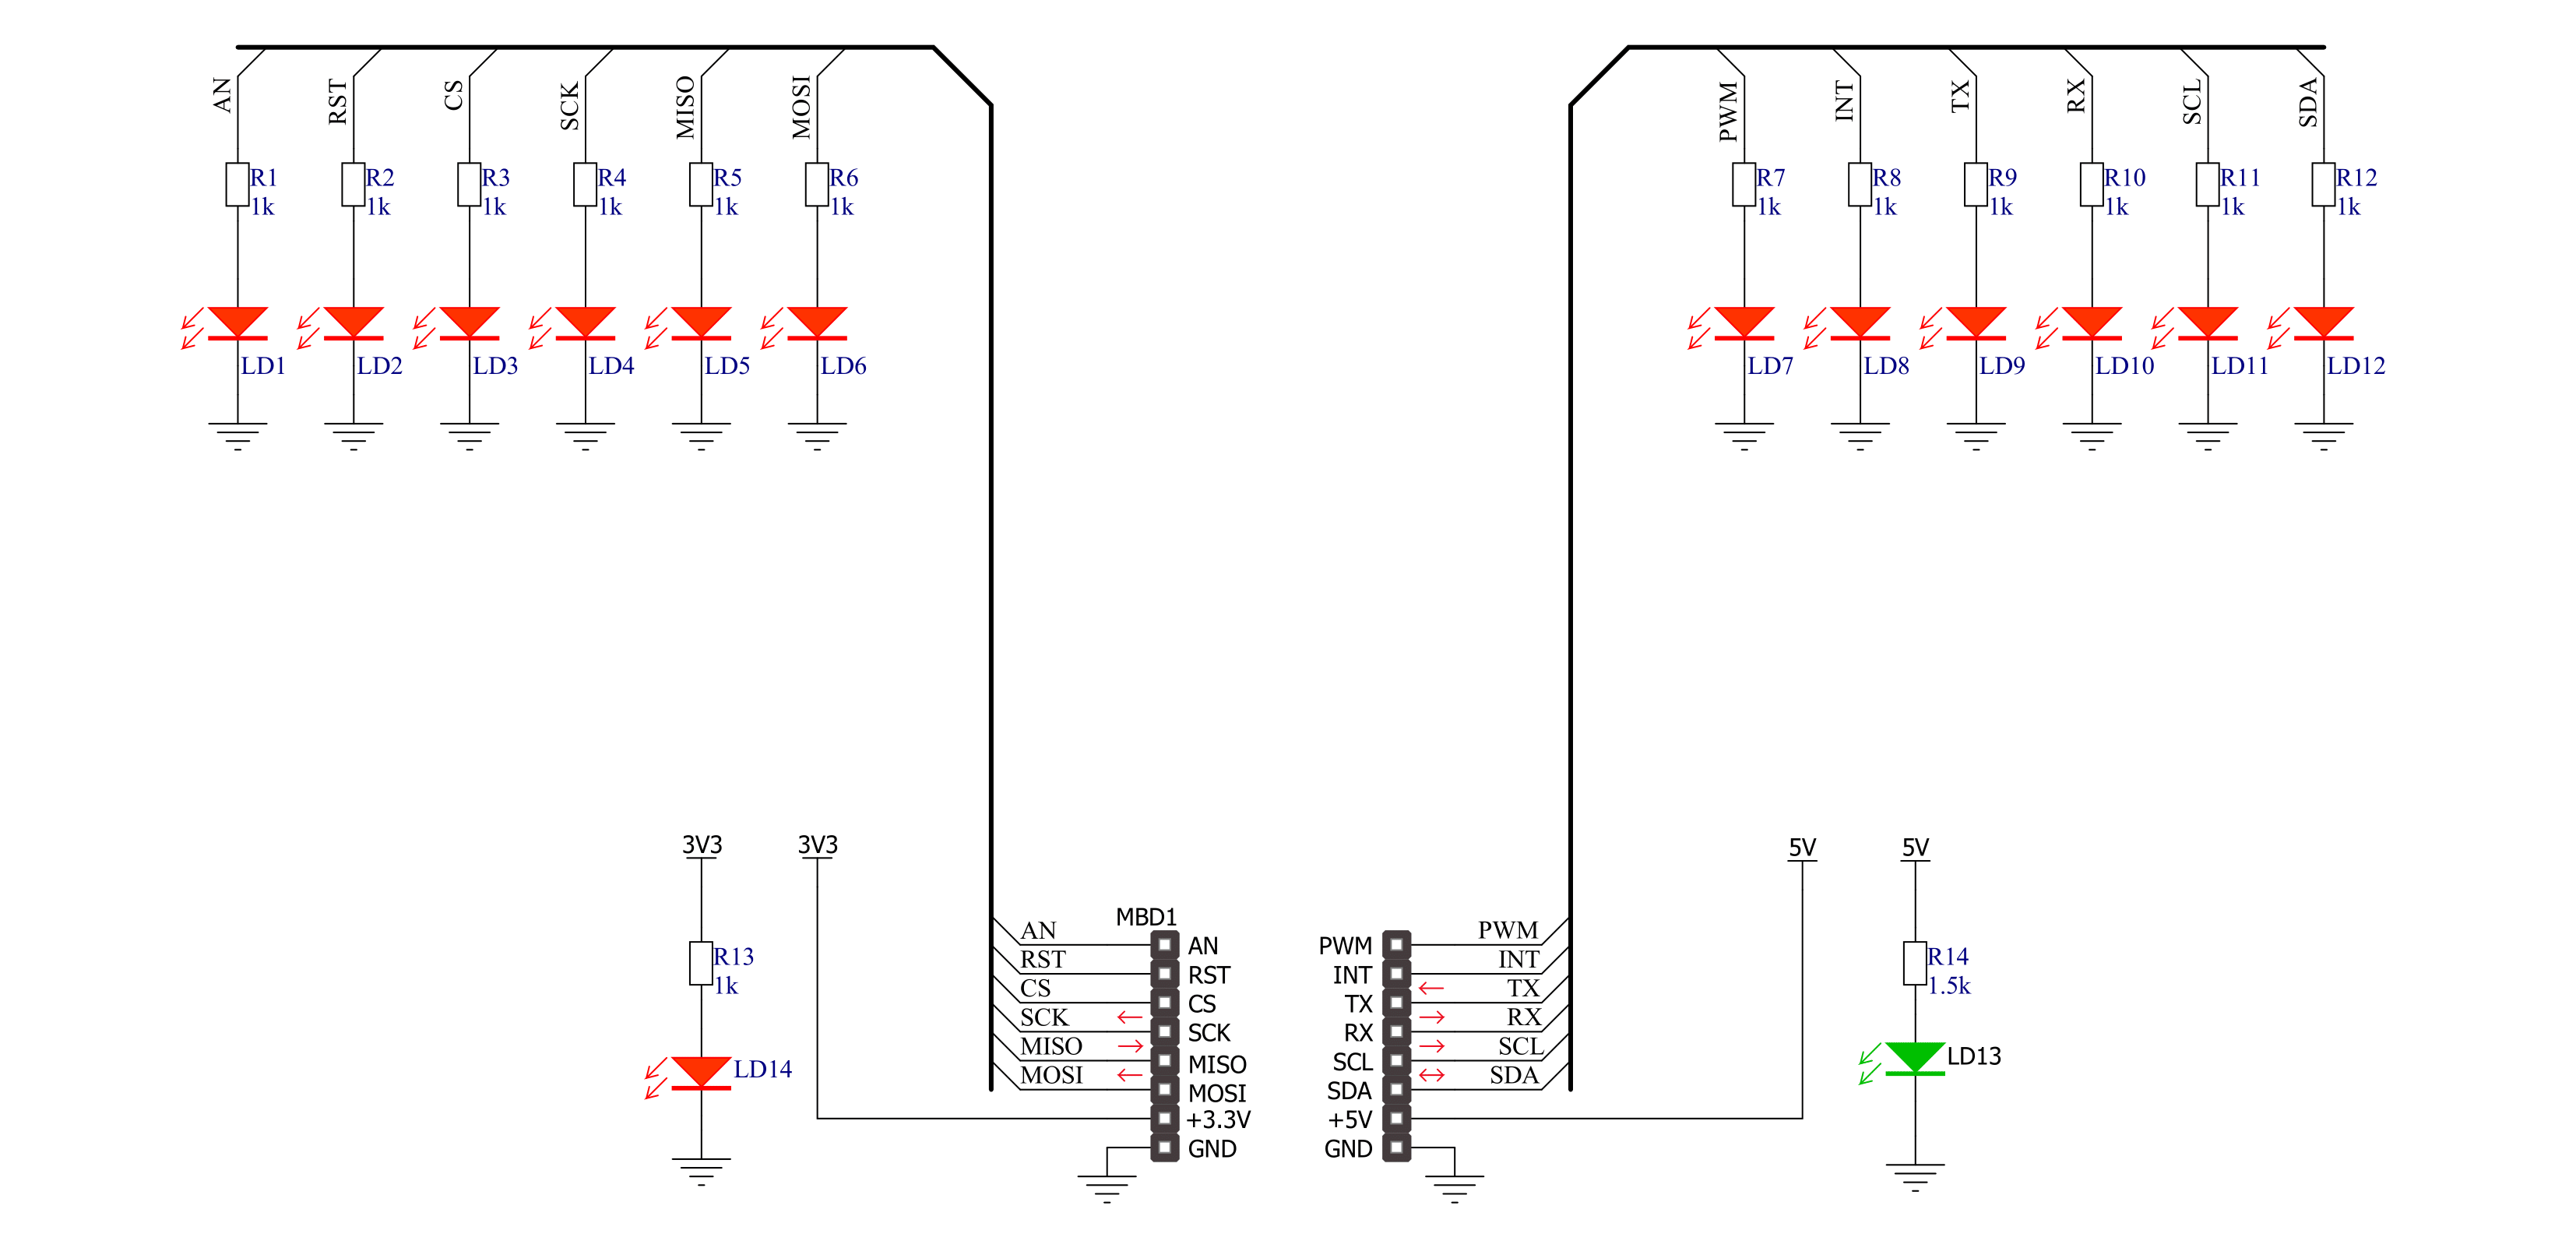
Tester Click is a Click board™ used as a diagnostic tool on the mikroBUS™ socket. It contains an array of 2x6 LEDs, which signalize the presence of the HIGH/LOW logic level on each pin, providing a visual feedback to the developer. Two additional LEDs indicate the presence of +3.3V and +5V on the mikroBUS™ power rails. This simple diagnostic tool can save hours of troubleshooting, saving the
application developer from having to connect various complicated measurement instruments, only to test logic states on the specific mikroBUS™ pins. Each pin of the mikroBUS™ is routed to a red colored LED, which is protected by 1K resistor. This allows voltages up to VCC to be handled with no issues, providing a simple and clean solution for pin state testing. Once placed on the mikroBUS™
socket, no additional settings are required. There are no ICs or other active elements besides the LEDs. Its simplicity makes it very simple to use: as soon as it is connected, red and green power indication LEDs will signalize the presence of +3.3V and +5V on both the mikroBUS™ power rails. The rest of the LED array will be lit according to the state on the respective pin.


Features overview
Development board
Curiosity PIC32 MZ EF development board is a fully integrated 32-bit development platform featuring the high-performance PIC32MZ EF Series (PIC32MZ2048EFM) that has a 2MB Flash, 512KB RAM, integrated FPU, Crypto accelerator, and excellent connectivity options. It includes an integrated programmer and debugger, requiring no additional hardware. Users can expand
functionality through MIKROE mikroBUS™ Click™ adapter boards, add Ethernet connectivity with the Microchip PHY daughter board, add WiFi connectivity capability using the Microchip expansions boards, and add audio input and output capability with Microchip audio daughter boards. These boards are fully integrated into PIC32’s powerful software framework, MPLAB Harmony,
which provides a flexible and modular interface to application development a rich set of inter-operable software stacks (TCP-IP, USB), and easy-to-use features. The Curiosity PIC32 MZ EF development board offers expansion capabilities making it an excellent choice for a rapid prototyping board in Connectivity, IOT, and general-purpose applications.

Microcontroller Overview
MCU Card / MCU
Architecture
PIC32
MCU Memory (KB)
2048
Silicon Vendor
Microchip
Pin count
100
RAM (Bytes)
524288
Used MCU Pins
mikroBUS™ mapper
Take a closer look
Click board™ Schematic
Step by step
Project assembly

Start by selecting your development board and Click board™. Begin with the Curiosity PIC32 MZ EF as your development board.


Track your results in real time
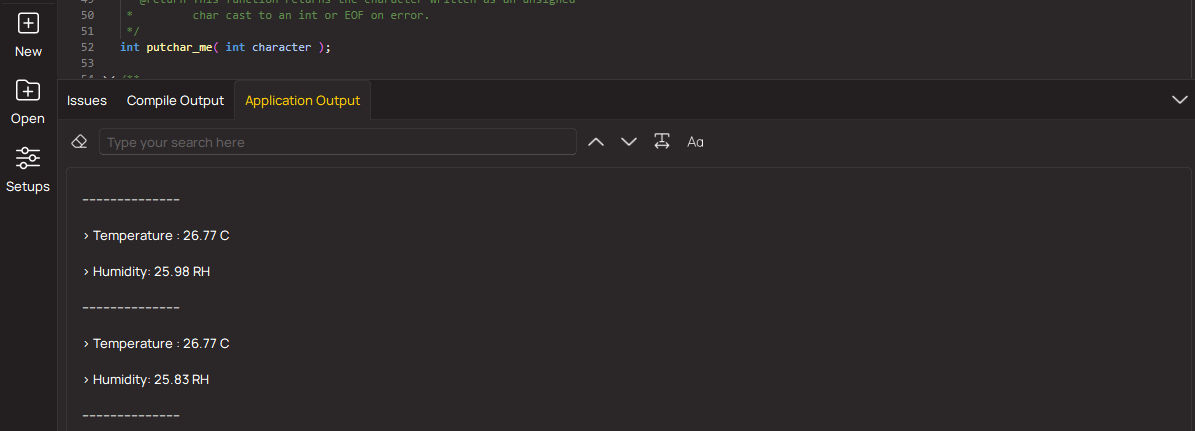
Application Output
1. Application Output - In Debug mode, the 'Application Output' window enables real-time data monitoring, offering direct insight into execution results. Ensure proper data display by configuring the environment correctly using the provided tutorial.
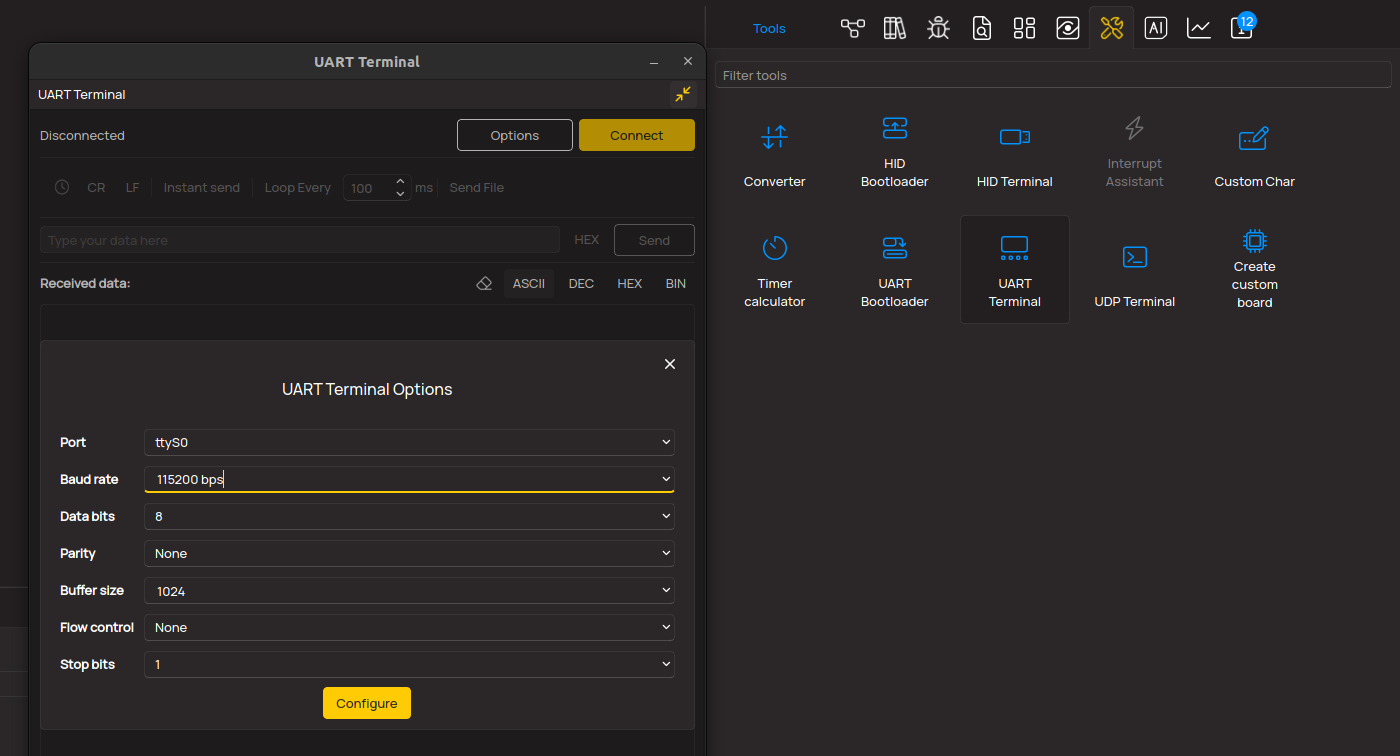
2. UART Terminal - Use the UART Terminal to monitor data transmission via a USB to UART converter, allowing direct communication between the Click board™ and your development system. Configure the baud rate and other serial settings according to your project's requirements to ensure proper functionality. For step-by-step setup instructions, refer to the provided tutorial.
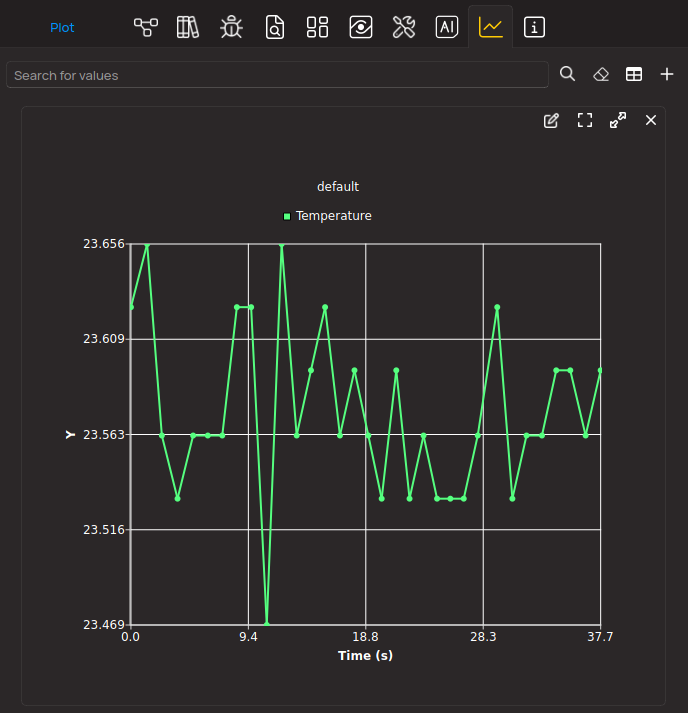
3. Plot Output - The Plot feature offers a powerful way to visualize real-time sensor data, enabling trend analysis, debugging, and comparison of multiple data points. To set it up correctly, follow the provided tutorial, which includes a step-by-step example of using the Plot feature to display Click board™ readings. To use the Plot feature in your code, use the function: plot(*insert_graph_name*, variable_name);. This is a general format, and it is up to the user to replace 'insert_graph_name' with the actual graph name and 'variable_name' with the parameter to be displayed.
Software Support
Library Description
This library contains API for Tester Click driver.
Key functions:
tester_set_pin_high- This function sets the output voltage on the specified pin to hightester_set_pin_low- This function sets the output voltage on the specified pin to low
Open Source
Code example
The complete application code and a ready-to-use project are available through the NECTO Studio Package Manager for direct installation in the NECTO Studio. The application code can also be found on the MIKROE GitHub account.
/*!
 * \file
 * \brief Tester Click example
 *
 * # Description
 * This example showcases how to initialize, configure and use the Tester Click. It is a simple
 * GPIO Click which is used to test if all the pins on a MikroBUS are working correctly.
 *
 * The demo application is composed of two sections :
 *
 * ## Application Init
 * This function initializes and configures the Click and logger modules.
 *
 * ## Application Task
 * This function sets the output on all the pins (one by one) on the left side to high, going
 * from top to bottom and then does the same with the ones on the right side, after which it
 * sets all pins to high and after one second sets them back to low.
 *
 * \author MikroE Team
 *
 */
// ------------------------------------------------------------------- INCLUDES

#include "board.h"
#include "log.h"
#include "tester.h"

// ------------------------------------------------------------------ VARIABLES

static tester_t tester;
static log_t logger;

static digital_out_t *pin_addr[ 12 ] =
{
    &tester.mosi,    // 0 MOSI
    &tester.miso,    // 1 MISO
    &tester.sck,     // 2 SCK
    &tester.cs,      // 3 CS
    &tester.rst,     // 4 RST
    &tester.an,      // 5 AN
    &tester.pwm,     // 6 PWM
    &tester.int_pin, // 7 INT
    &tester.tx_pin,  // 8 TX
    &tester.rx_pin,  // 9 RX
    &tester.scl,     // 10 SCL
    &tester.sda      // 11 SDA
};

// ------------------------------------------------------- ADDITIONAL FUNCTIONS

static void blink ( digital_out_t *pin )
{
    tester_set_pin_high( pin );
    Delay_100ms( );
    tester_set_pin_low( pin );
}

static void all_on ( )
{
   int i;

   for( i = 0; i < 12; i++ )
   {
        tester_set_pin_high( pin_addr[ i ] );
   }
}

static void all_off ( )
{
   int i;

   for( i = 0; i < 12; i++ )
   {
        tester_set_pin_low( pin_addr[ i ] );
   }
}

// ------------------------------------------------------ APPLICATION FUNCTIONS

void application_init ( )
{
    log_cfg_t log_cfg;
    tester_cfg_t cfg;

    /**
     * Logger initialization.
     * Default baud rate: 115200
     * Default log level: LOG_LEVEL_DEBUG
     * @note If USB_UART_RX and USB_UART_TX
     * are defined as HAL_PIN_NC, you will
     * need to define them manually for log to work.
     * See @b LOG_MAP_USB_UART macro definition for detailed explanation.
     */
    LOG_MAP_USB_UART( log_cfg );
    log_init( &logger, &log_cfg );
    log_info(&logger, "---- Application Init ----");

    //  Click initialization.

    tester_cfg_setup( &cfg );
    TESTER_MAP_MIKROBUS( cfg, MIKROBUS_1 );
    tester_init( &tester, &cfg );
}

void application_task ( )
{
    int i;

    for( i = 0; i < 12; i++ )
    {
        blink( pin_addr[ i ] );
    }

    all_on( );
    Delay_1sec( );
    all_off( );
}

int main ( void )
{
    /* Do not remove this line or clock might not be set correctly. */
    #ifdef PREINIT_SUPPORTED
    preinit();
    #endif

    application_init( );

    for ( ; ; )
    {
        application_task( );
    }

    return 0;
}

// ------------------------------------------------------------------------ END


