Identify and address power quality issues promptly with ACS37800 and PIC32MZ2048EFM100
Track and analyze power usage trends

Published Oct 02, 2023
Click board™
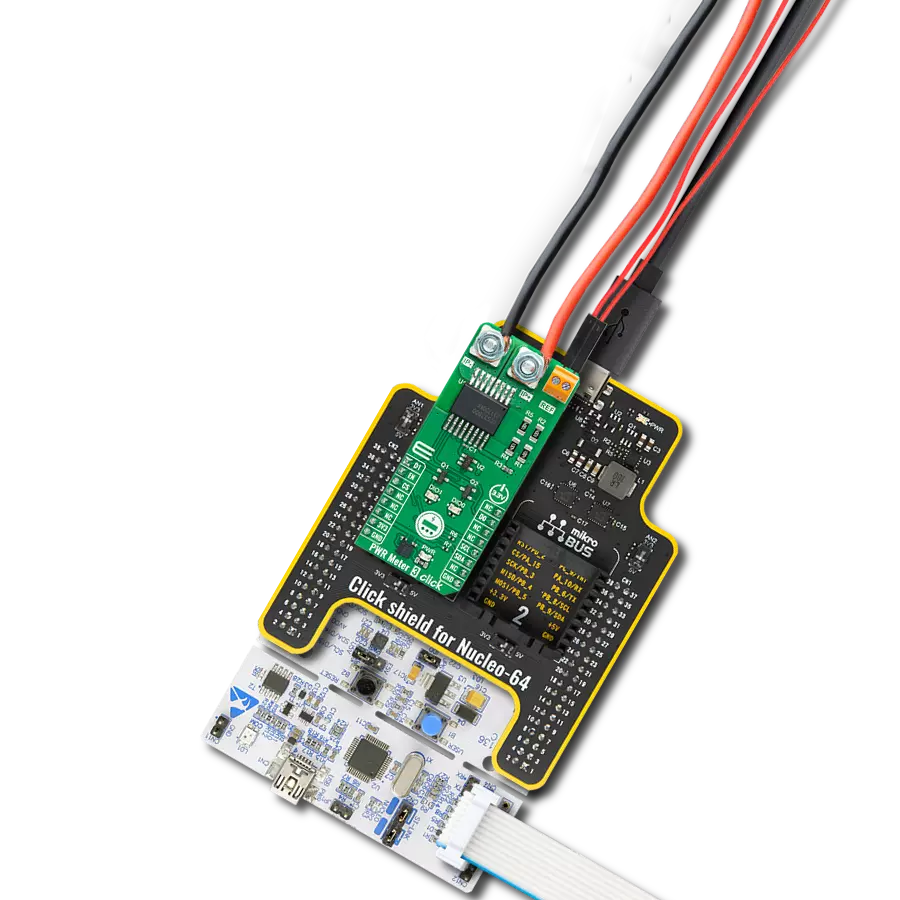
PWR Meter 3 Click - 90A
Dev. board
Curiosity PIC32 MZ EF
Compiler
NECTO Studio
MCU
PIC32MZ2048EFM100
Our solution is designed to accurately measure voltage and current through your connected load, providing critical insights into electrical performance
A
A
Hardware Overview
How does it work?
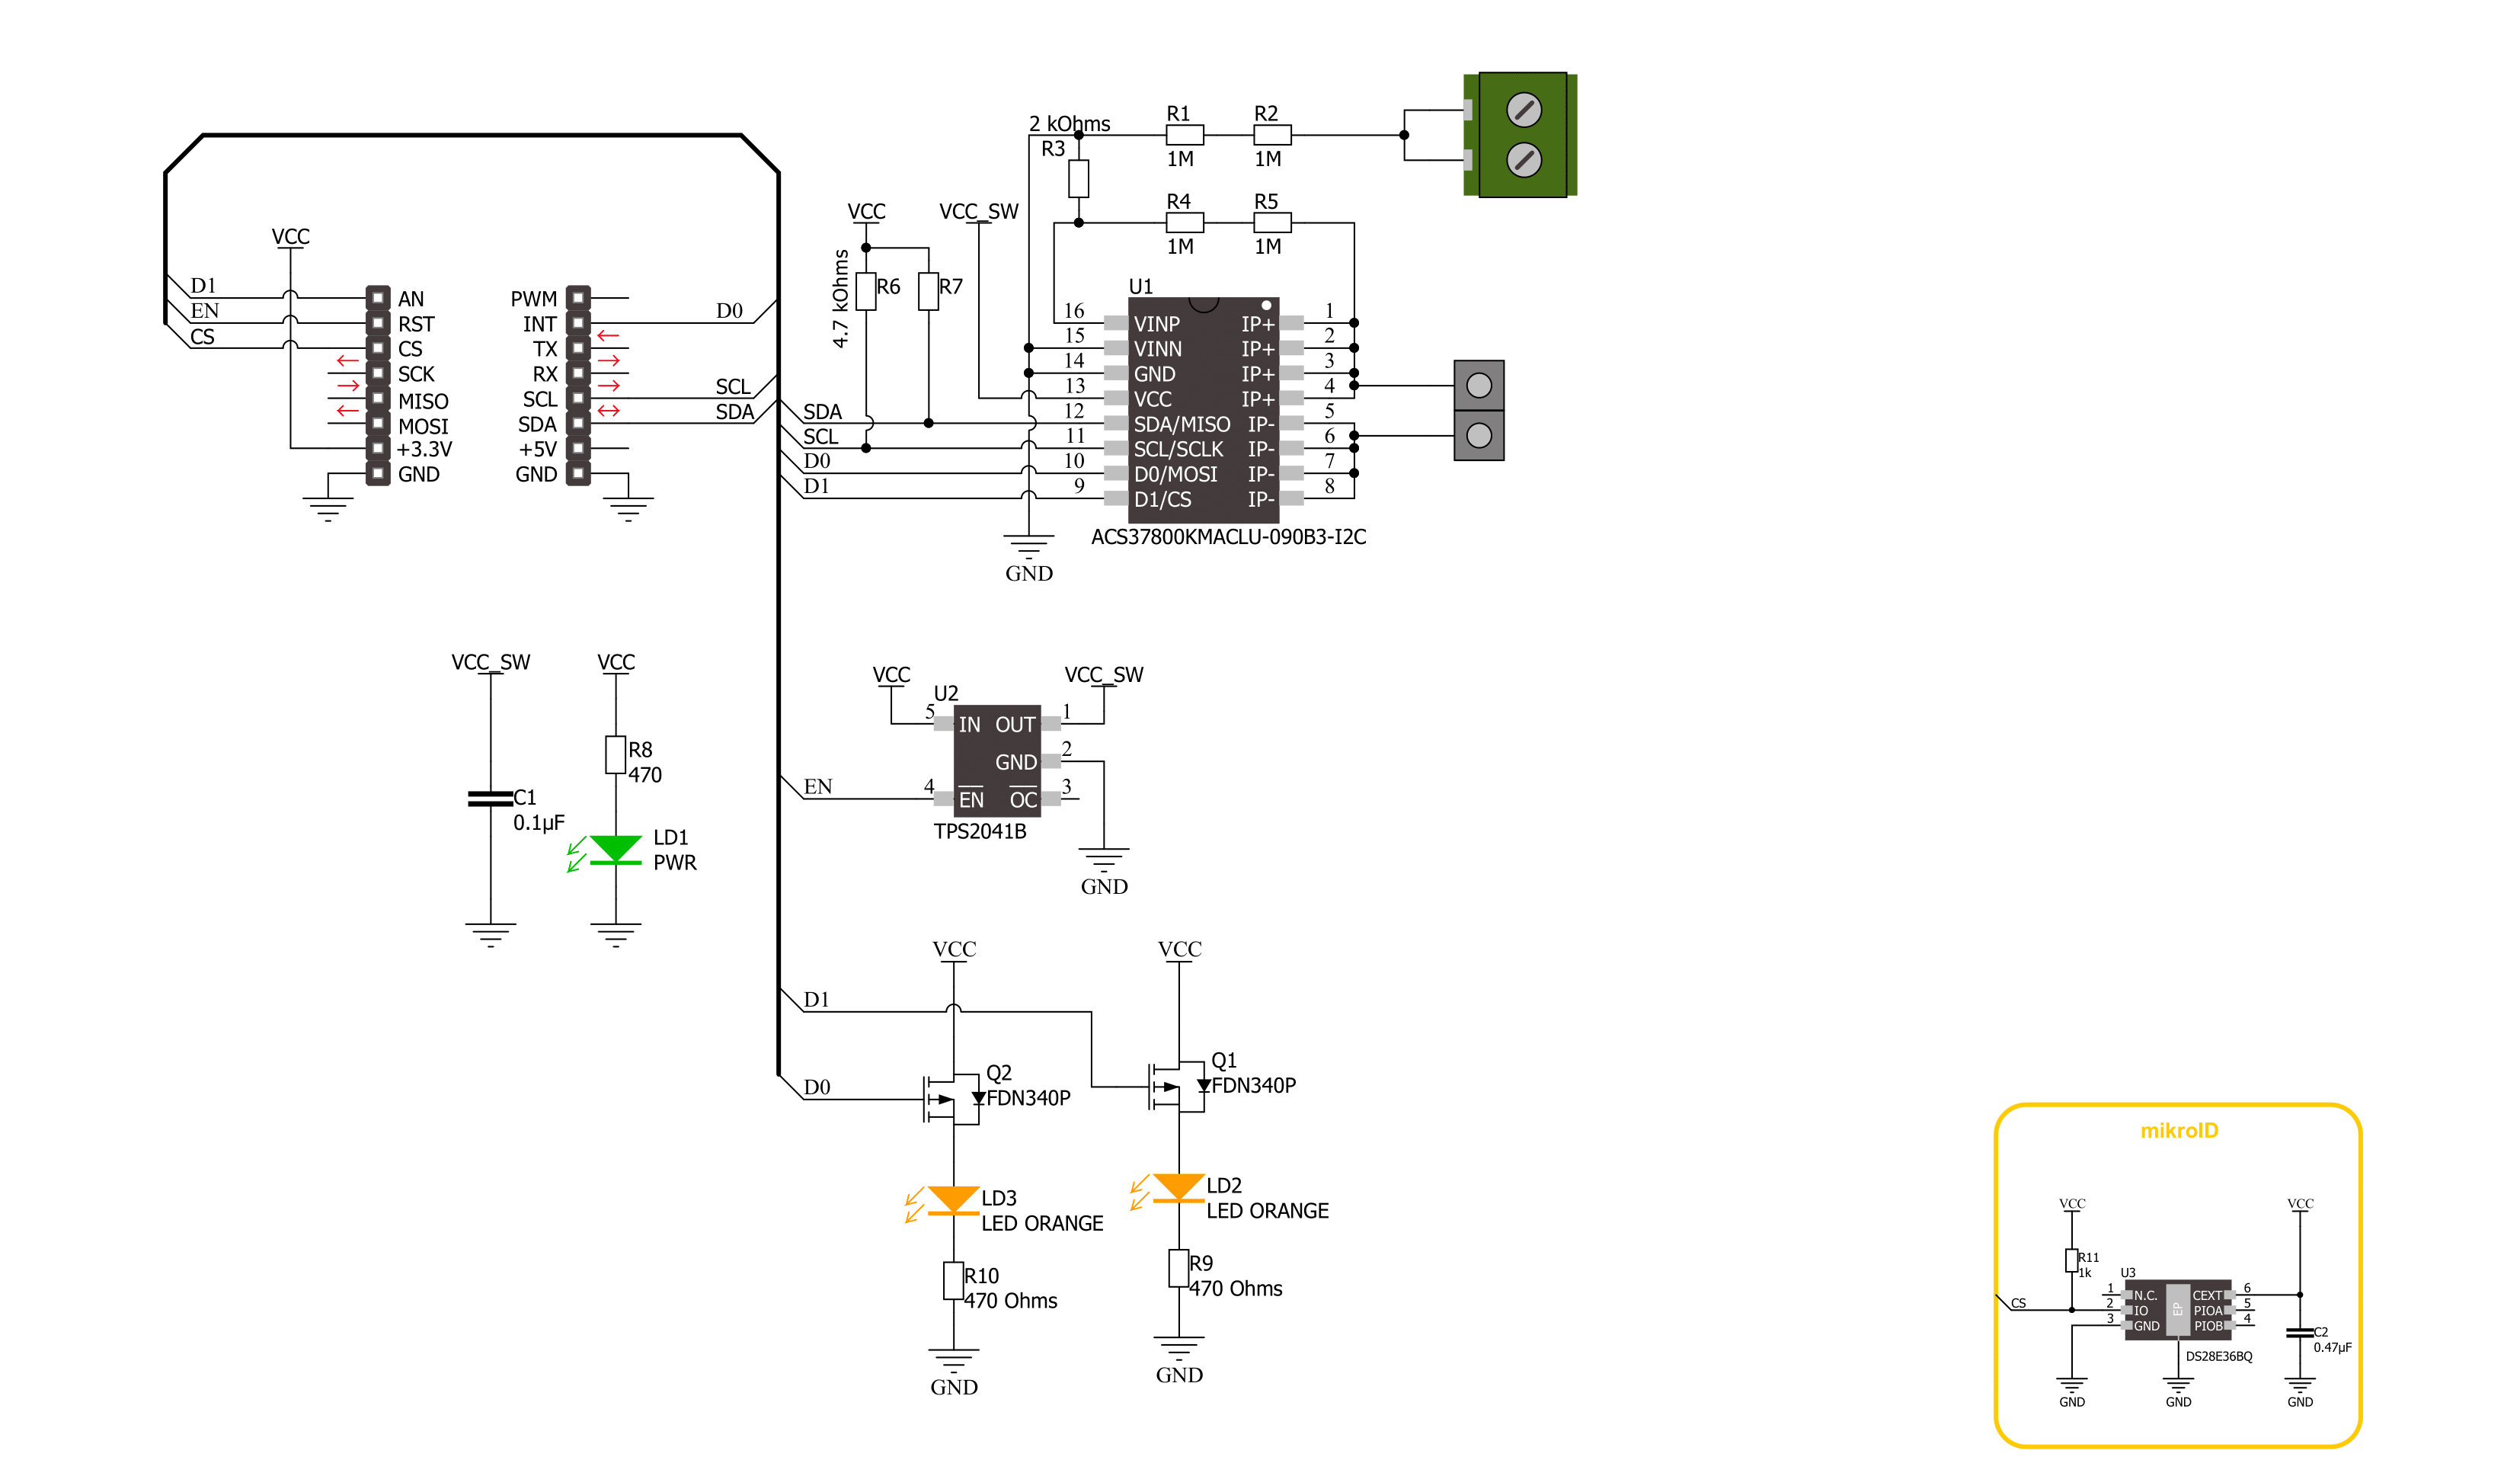
PWR Meter 3 Click is based on the ACS37800, a simple solution for voltage, current, and power monitoring from Allegro MicroSystems, which simplifies the addition of power monitoring in 60Hz to many AC/DC applications. The ACS37800 includes a copper conduction path that generates a magnetic field proportional to the applied current, sensed differentially to reject errors introduced by common mode fields. It is particularly well suited for high isolation, achieving reinforced isolation ratings of 4800 VRMS and a reliable ±90A bidirectional current sensing range. With high configurability and integrated features, this Click board™ can fit most power monitoring applications. The ACS37800 measures the voltage applied to the REF terminal, in the range from 9.5 to 27V, by resistor dividing it down to fit the input range of the onboard voltage sense amplifier and
add isolation. On the other hand, the current applied to the current sensing terminals is measured using the integrated current loop and galvanically isolated Hall sensor. Both analog signals are then sampled using integrated high-accuracy ADCs before entering the digital system. The metrology engine later determines the frequency, calculates RMS values of current, voltage, and power, and provides a range of averaging and configuration options. PWR Meter 3 Click communicates with an MCU using the standard I2C 2-Wire interface to read data and configure settings, supporting Standard Mode operation with a clock frequency of 100kHz and Fast Mode up to 400kHz. The ACS37800 can be turned on, or off through the EN pin routed to the RST pin of the mikroBUS™ socket, hence offering a switch operation to turn ON/OFF power delivery
to the ACS37800 via TPS2041B. Along with the ability to measure current and voltage, it also has two LED indicators, DIO0 and DIO1, for the realization of visual detection of some anomalies in operation, such as undervoltage and overvoltage reporting, and fast overcurrent fault detection. The DIO0 LED default state application is for zero crossing, while DIO1 stands for overcurrent detection. In addition to the LEDs, this information can be detected through the INT and AN pins of the mikroBUS™ socket, marked as D0 and D1. This Click board™ can be operated only with a 3.3V logic voltage level. The board must perform appropriate logic voltage level conversion before using MCUs with different logic levels. Also, it comes equipped with a library containing functions and an example code that can be used as a reference for further development.

Features overview
Development board
Curiosity PIC32 MZ EF development board is a fully integrated 32-bit development platform featuring the high-performance PIC32MZ EF Series (PIC32MZ2048EFM) that has a 2MB Flash, 512KB RAM, integrated FPU, Crypto accelerator, and excellent connectivity options. It includes an integrated programmer and debugger, requiring no additional hardware. Users can expand
functionality through MIKROE mikroBUS™ Click™ adapter boards, add Ethernet connectivity with the Microchip PHY daughter board, add WiFi connectivity capability using the Microchip expansions boards, and add audio input and output capability with Microchip audio daughter boards. These boards are fully integrated into PIC32’s powerful software framework, MPLAB Harmony,
which provides a flexible and modular interface to application development a rich set of inter-operable software stacks (TCP-IP, USB), and easy-to-use features. The Curiosity PIC32 MZ EF development board offers expansion capabilities making it an excellent choice for a rapid prototyping board in Connectivity, IOT, and general-purpose applications.

Microcontroller Overview
MCU Card / MCU
Architecture
PIC32
MCU Memory (KB)
2048
Silicon Vendor
Microchip
Pin count
100
RAM (Bytes)
524288
Used MCU Pins
mikroBUS™ mapper
Take a closer look
Click board™ Schematic
Step by step
Project assembly

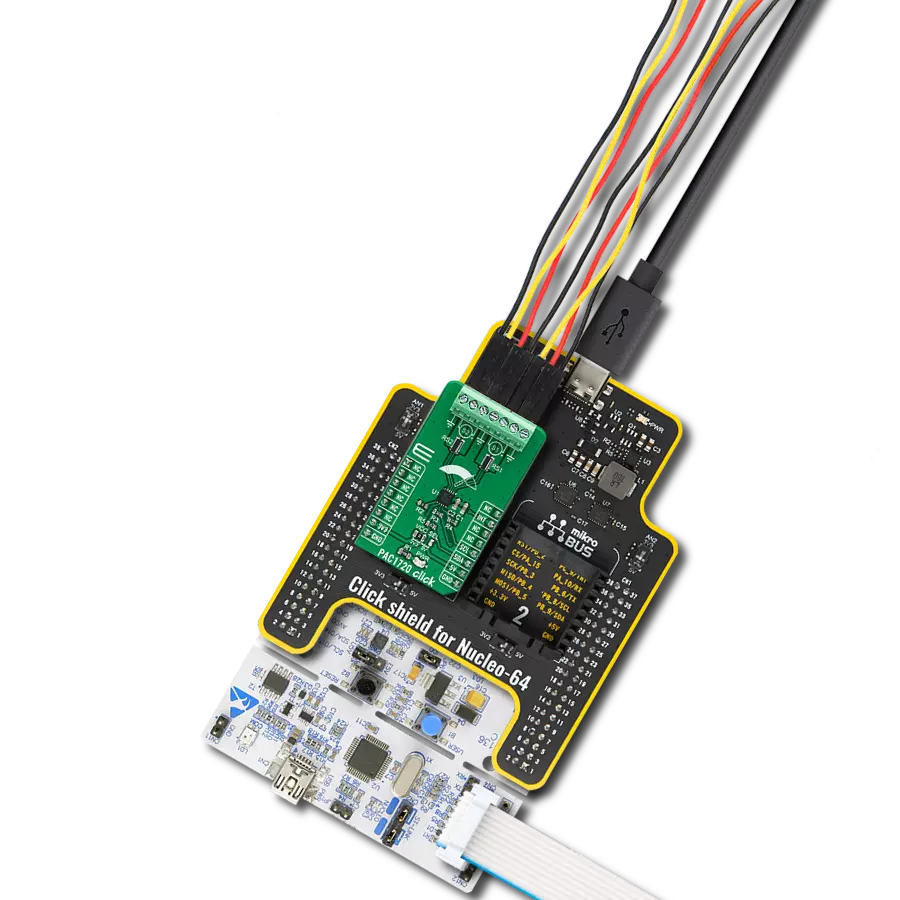
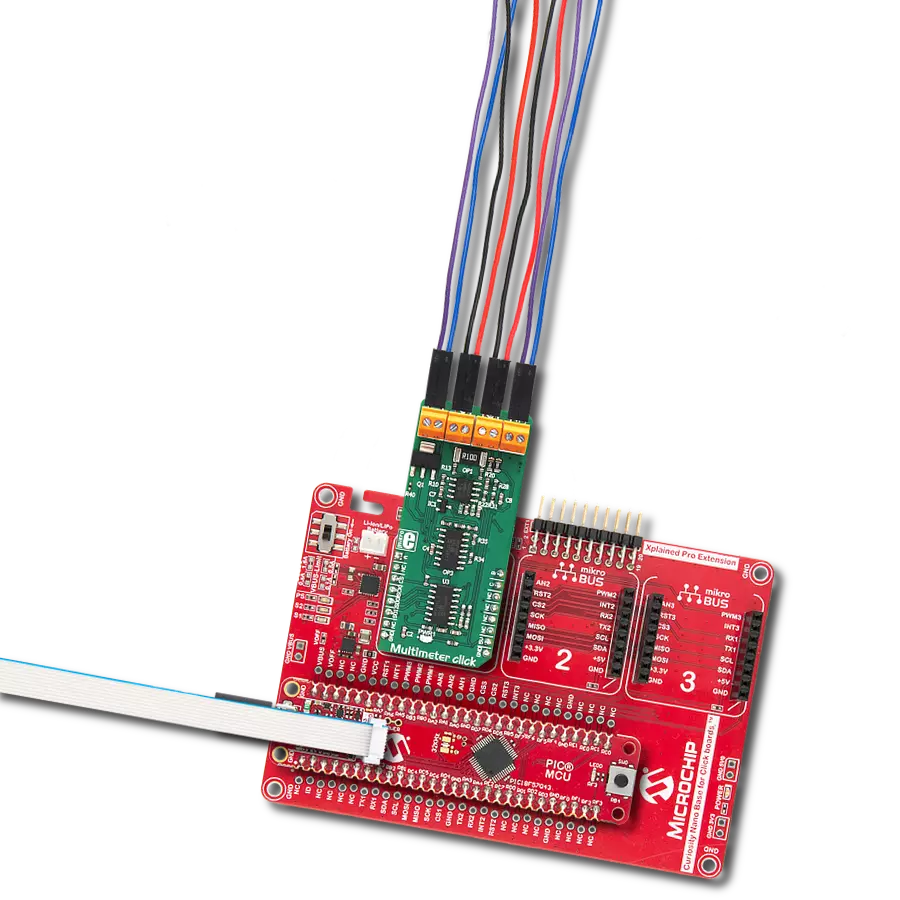
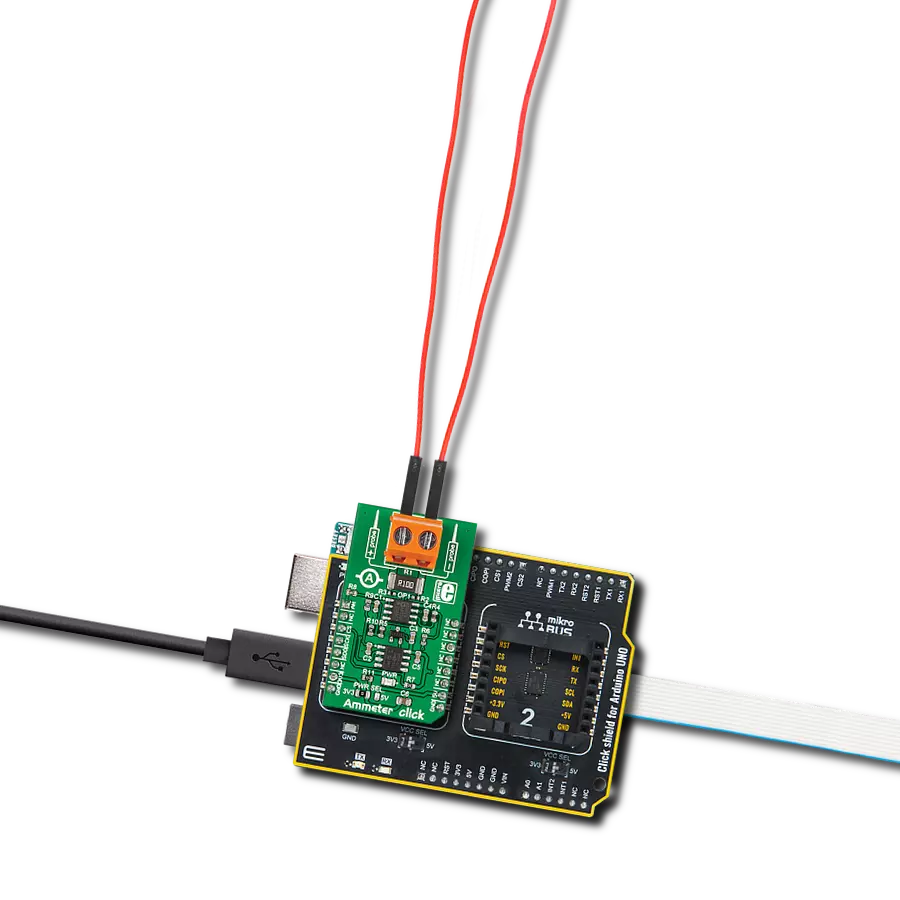
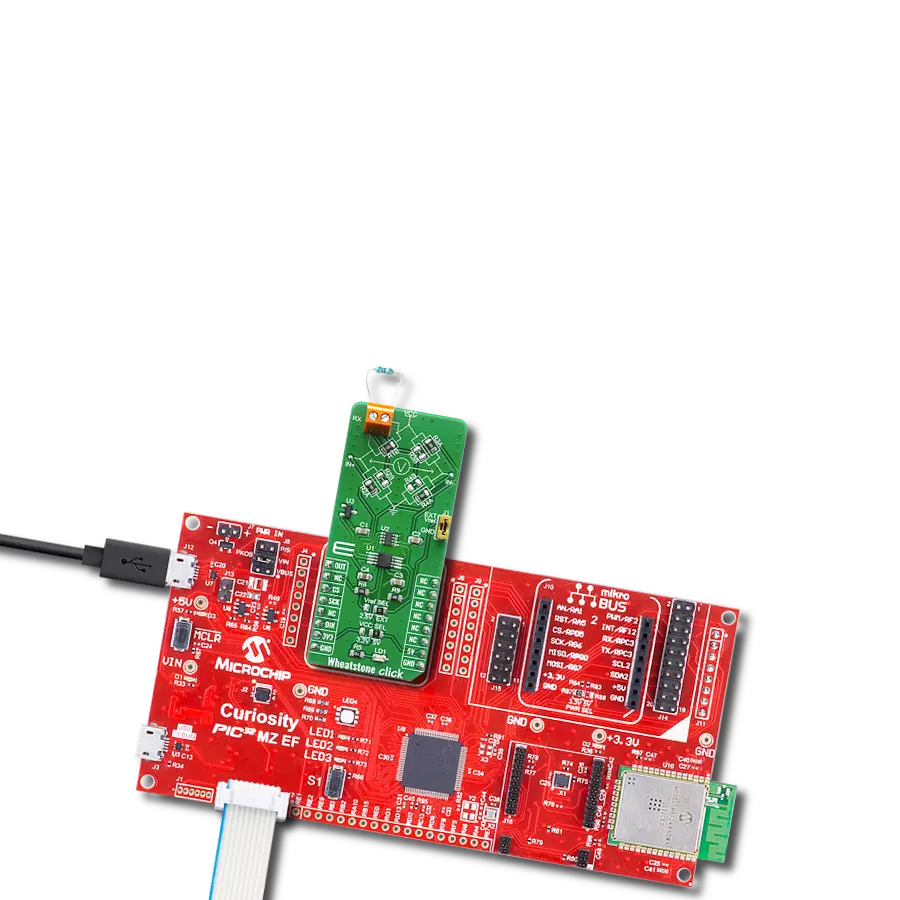
Start by selecting your development board and Click board™. Begin with the Curiosity PIC32 MZ EF as your development board.


Software Support
Library Description
This library contains API for PWR Meter 3 Click driver.
Key functions:
pwrmeter3_get_dio0_pin- This function returns the DIO0 pin logic statepwrmeter3_get_dio1_pin- This function returns the DIO1 pin logic statepwrmeter3_read_average_rms- This function reads the voltage and current RMS measurements averaged from a specified number of samples
Open Source
Code example
The complete application code and a ready-to-use project are available through the NECTO Studio Package Manager for direct installation in the NECTO Studio. The application code can also be found on the MIKROE GitHub account.
/*!
 * @file main.c
 * @brief PWR Meter 3 90A Click example
 *
 * # Description
 * This example demonstrates the use of PWR Meter 3 90A Click board by reading and displaying
 * the voltage, current, and power RMS measurements.
 *
 * The demo application is composed of two sections :
 *
 * ## Application Init
 * Initializes the driver and performs the Click default configuration which sets the DC measurement
 * and VRMS thresholds to about 28V for overvoltage and about 9.3V for undervoltage flag.
 *
 * ## Application Task
 * Reads the voltage and current RMS values averaged from 500 samples, then calculates the power from it
 * and displays the results on the USB UART. Also if an UV or OV flag is detected it will be logged accordingly.
 *
 * @author Stefan Filipovic
 *
 */

#include "board.h"
#include "log.h"
#include "pwrmeter390a.h"

static pwrmeter390a_t pwrmeter390a;
static log_t logger;

void application_init ( void )
{
    log_cfg_t log_cfg;  /**< Logger config object. */
    pwrmeter390a_cfg_t pwrmeter390a_cfg;  /**< Click config object. */

    /**
     * Logger initialization.
     * Default baud rate: 115200
     * Default log level: LOG_LEVEL_DEBUG
     * @note If USB_UART_RX and USB_UART_TX
     * are defined as HAL_PIN_NC, you will
     * need to define them manually for log to work.
     * See @b LOG_MAP_USB_UART macro definition for detailed explanation.
     */
    LOG_MAP_USB_UART( log_cfg );
    log_init( &logger, &log_cfg );
    log_info( &logger, " Application Init " );

    // Click initialization.
    pwrmeter390a_cfg_setup( &pwrmeter390a_cfg );
    PWRMETER390A_MAP_MIKROBUS( pwrmeter390a_cfg, MIKROBUS_1 );
    if ( I2C_MASTER_ERROR == pwrmeter390a_init( &pwrmeter390a, &pwrmeter390a_cfg ) )
    {
        log_error( &logger, " Communication init." );
        for ( ; ; );
    }

    if ( PWRMETER390A_ERROR == pwrmeter390a_default_cfg ( &pwrmeter390a ) )
    {
        log_error( &logger, " Default configuration." );
        for ( ; ; );
    }

    log_info( &logger, " Application Task " );
}

void application_task ( void )
{
    float v_rms, i_rms;
    if ( PWRMETER390A_OK == pwrmeter390a_read_average_rms ( &pwrmeter390a, &v_rms, &i_rms, PWRMETER390A_DEF_AVG_SAMPLES ) )
    {
        if ( !pwrmeter390a_get_dio0_pin ( &pwrmeter390a ) )
        {
            log_printf ( &logger, " Over-voltage detected!\r\n" );
        }
        if ( !pwrmeter390a_get_dio1_pin ( &pwrmeter390a ) )
        {
            log_printf ( &logger, " Under-voltage detected!\r\n" );
        }
        log_printf ( &logger, " Voltage: %.2f V\r\n", v_rms );
        log_printf ( &logger, " Current: %.2f A\r\n", i_rms );
        log_printf ( &logger, " Power: %.2f W\r\n\n", i_rms * v_rms );
    }
}

int main ( void )
{
    /* Do not remove this line or clock might not be set correctly. */
    #ifdef PREINIT_SUPPORTED
    preinit();
    #endif

    application_init( );

    for ( ; ; )
    {
        application_task( );
    }

    return 0;
}

// ------------------------------------------------------------------------ END
Additional Support
Resources
Category:Measurements