Achieve the highest level of precision in power monitoring with INA228 and PIC32MZ2048EFM100
Power insight redefined: Elevate performance with ultra-precise monitoring

Published Oct 09, 2023
Click board™
Power Monitor Click
Dev. board
Curiosity PIC32 MZ EF
Compiler
NECTO Studio
MCU
PIC32MZ2048EFM100
Our ultra-precise power monitoring solution redefines how you gain insight into your power usage, offering unmatched accuracy for optimizing performance, reducing costs, and ensuring the reliability of your systems
A
A
Hardware Overview
How does it work?
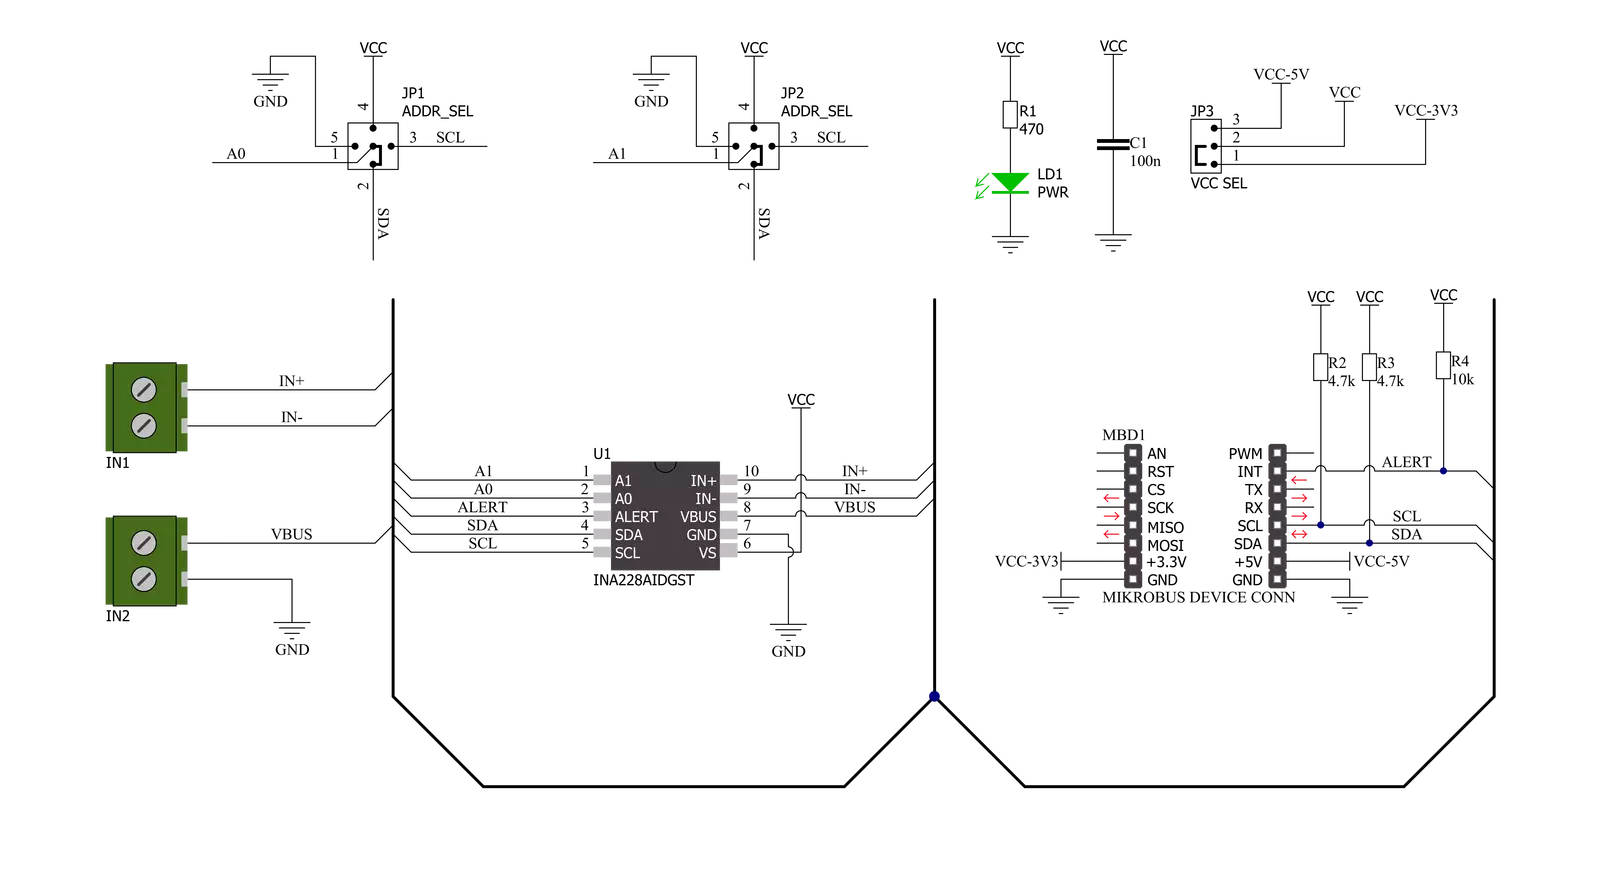
Power Monitor Click is based on the INA228, an ultra-precise digital power monitor with a 20-bit delta-sigma ADC and I2C digital interface from Texas Instruments. It measures shunt voltage, bus voltage, and internal temperature while calculating the current, power, energy, and charge necessary for accurate decisions in precisely controlled systems. It can measure a full-scale differential input of ±163.84mV or ±40.96mV across a resistive shunt sense element connected on the onboard IN terminal alongside common-mode voltage support up to +85V, which makes it well suited for both high-side and low-side current measurements. The INA228 also measures the bus supply voltage through the VBUS terminal and temperature through the integrated ±1°C accurate temperature sensor, which helps monitor the ambient system temperature. Power, charge, and energy calculations are performed in the
background and do not add to the overall ADC conversion time. Also, the very low offset voltage and noise allow for use in mA to kA sensing applications and provide a wide dynamic range without significant power dissipation losses on the sensing shunt element. Power Monitor Click communicates with MCU using the standard I2C 2-Wire interface to read data and configure settings, supporting a Fast Mode operation up to 400kHz. The INA228 also allows the selection of its I2C slave address using the two SMD cross-shape jumpers labeled A0 and A1. One cross-shape jumper has four positions for select address pins, which can be connected to GND, VS, SCL, or SDA pins. This way, the INA228 provides the opportunity of the 16 possible different I2C addresses by positioning the SMD jumper to an appropriate position. Besides, the INA228 also includes the multipurpose alert(interrupt) pin,
labeled as ALR and routed to the INT pin of the mikroBUS™ socket, used to report multiple diagnostics or as an indicator that the ADC conversion is complete when the device is operating in both triggered and continuous conversion mode. The diagnostics such as shunt over/under voltage limit, bus over/under voltage limit, or temperature or power over-limit are constantly monitored and reported through the ALR pin whenever the monitored output value crosses its associated out-of-range threshold. This Click board™ can operate with either 3.3V or 5V logic voltage levels selected via the VCC SEL jumper. This way, both 3.3V and 5V capable MCUs can use the communication lines properly. Also, this Click board™ comes equipped with a library containing easy-to-use functions and an example code that can be used as a reference for further development.

Features overview
Development board
Curiosity PIC32 MZ EF development board is a fully integrated 32-bit development platform featuring the high-performance PIC32MZ EF Series (PIC32MZ2048EFM) that has a 2MB Flash, 512KB RAM, integrated FPU, Crypto accelerator, and excellent connectivity options. It includes an integrated programmer and debugger, requiring no additional hardware. Users can expand
functionality through MIKROE mikroBUS™ Click™ adapter boards, add Ethernet connectivity with the Microchip PHY daughter board, add WiFi connectivity capability using the Microchip expansions boards, and add audio input and output capability with Microchip audio daughter boards. These boards are fully integrated into PIC32’s powerful software framework, MPLAB Harmony,
which provides a flexible and modular interface to application development a rich set of inter-operable software stacks (TCP-IP, USB), and easy-to-use features. The Curiosity PIC32 MZ EF development board offers expansion capabilities making it an excellent choice for a rapid prototyping board in Connectivity, IOT, and general-purpose applications.

Microcontroller Overview
MCU Card / MCU
Architecture
PIC32
MCU Memory (KB)
2048
Silicon Vendor
Microchip
Pin count
100
RAM (Bytes)
524288
Used MCU Pins
mikroBUS™ mapper
Take a closer look
Click board™ Schematic
Step by step
Project assembly

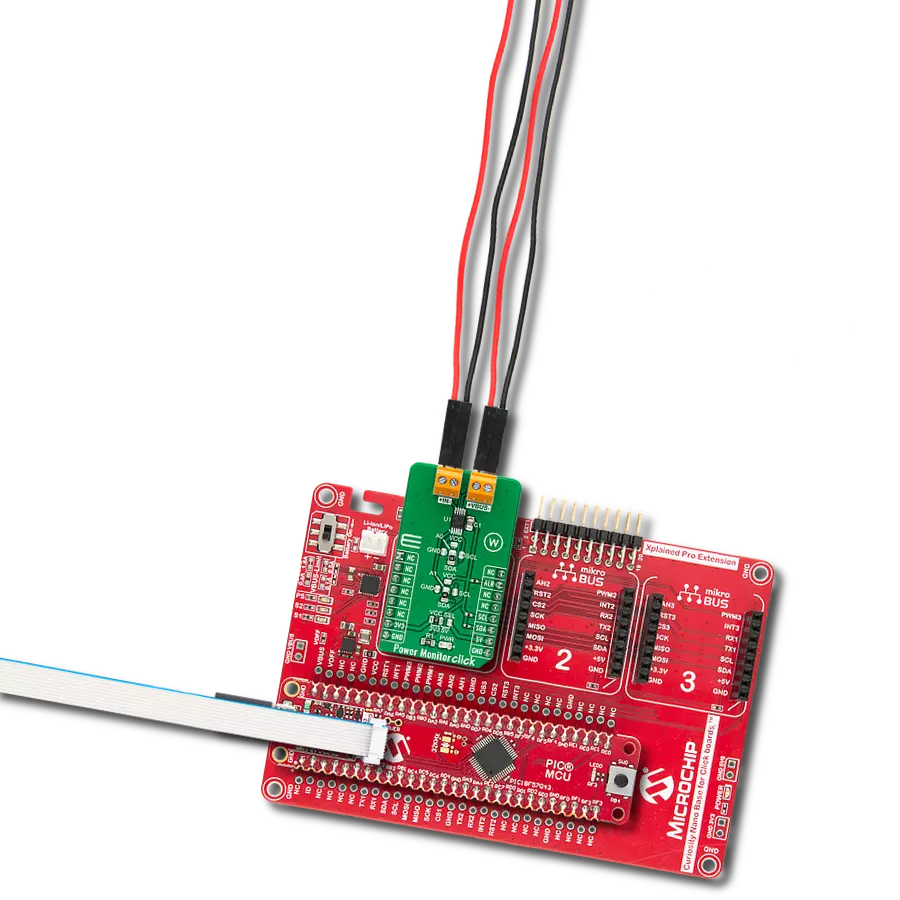
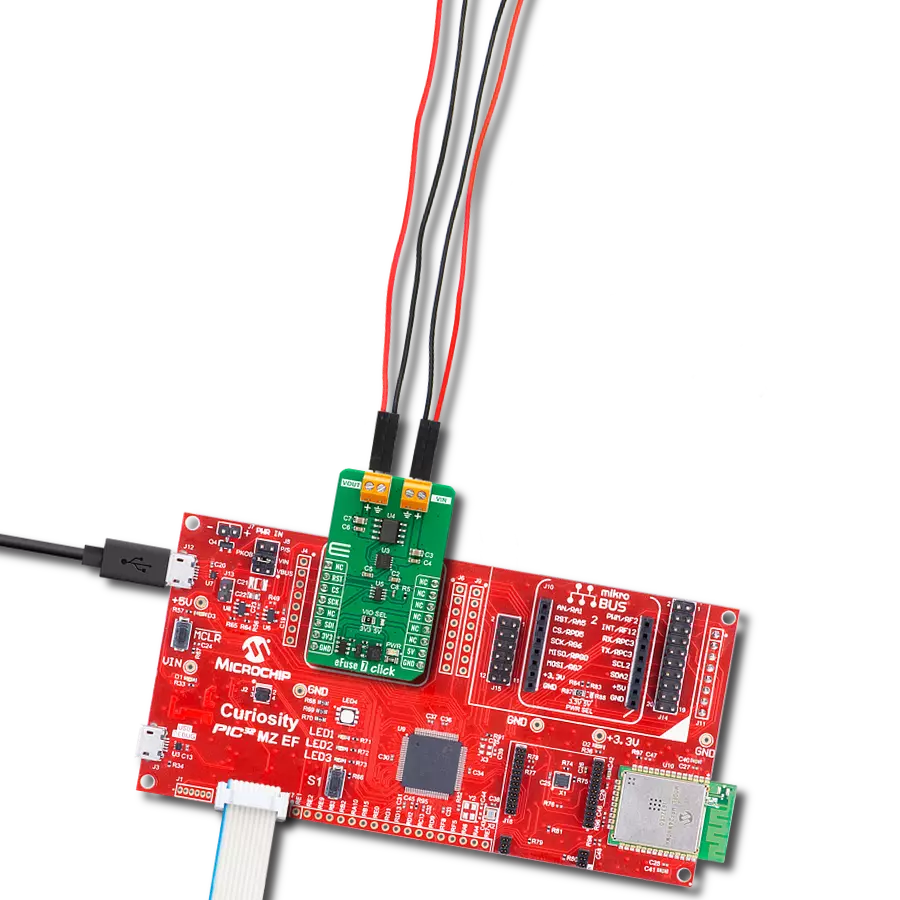
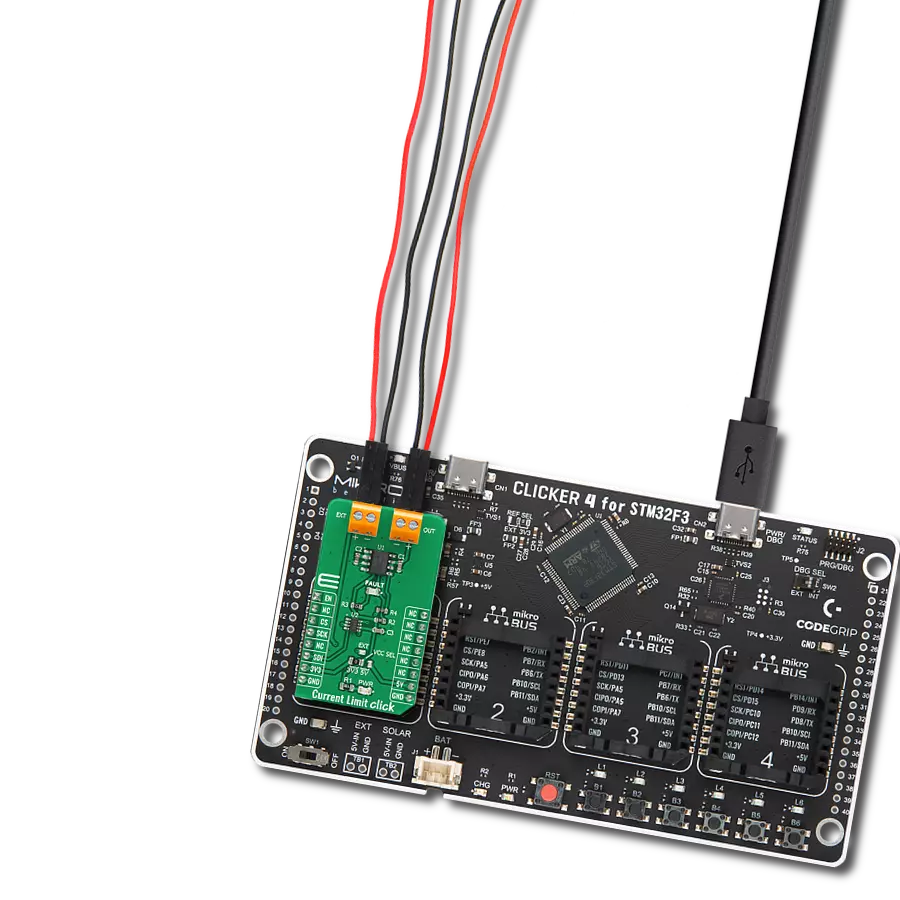
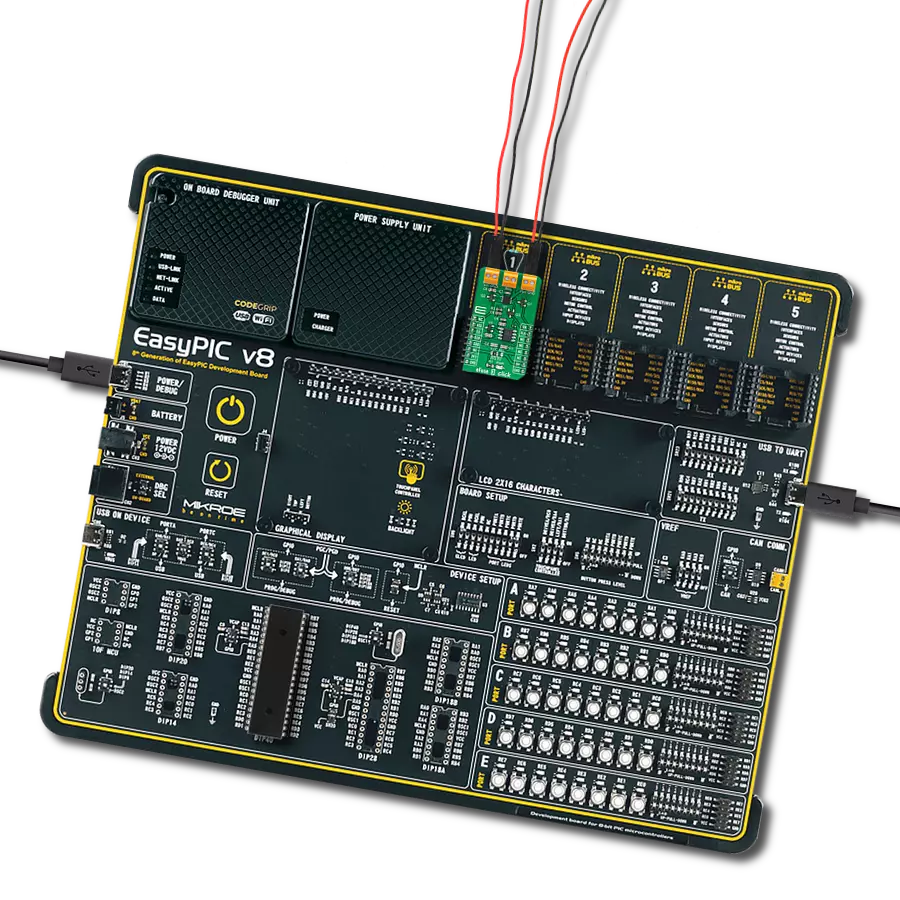
Start by selecting your development board and Click board™. Begin with the Curiosity PIC32 MZ EF as your development board.


Software Support
Library Description
This library contains API for Power Monitor Click driver.
Key functions:
powermonitor_get_vshunt- Power Monitor get shunt voltage functionpowermonitor_get_vbus- Power Monitor get bus voltage functionpowermonitor_get_current- Power Monitor get current function
Open Source
Code example
The complete application code and a ready-to-use project are available through the NECTO Studio Package Manager for direct installation in the NECTO Studio. The application code can also be found on the MIKROE GitHub account.
/*!
* @file main.c
* @brief PowerMonitor Click example
*
* # Description
* This library contains API for Power Monitor Click driver.
* The library initializes and defines the I2C bus drivers
* to write and read data from registers.
* The library also includes a function for reading
* Shunt and Bus voltage ( mV ), Current ( mA ), Power ( W ), Energy ( J ),
* as well as the Temperature in degrees Celsius.
*
* The demo application is composed of two sections :
*
* ## Application Init
* The initialization of I2C module, log UART, and additional pins.
* After the driver init and then executes a default configuration,
* the app checks communication, display Manufacturer, Stores Device and Revision ID.
*
* ## Application Task
* This is an example that shows the use of a Power Monitor Click board™.
* Measures and displays Shunt voltage ( mV ), Bus voltage ( mV ),
* Current ( mA ), Power ( W ), Energy ( J ) and Temperature ( degrees Celsius ).
* Results are being sent to the USART terminal where the user can track their changes.
* This task repeats every 2.5 sec.
*
* @author Nenad Filipovic
*
*/
#include "board.h"
#include "log.h"
#include "powermonitor.h"
static powermonitor_t powermonitor;
static log_t logger;
void application_init ( void )
{
log_cfg_t log_cfg; /**< Logger config object. */
powermonitor_cfg_t powermonitor_cfg; /**< Click config object. */
static uint8_t manufacturer_id[ 2 ];
static uint16_t dieid;
static uint8_t rev_id;
powermonitor.shunt = 0.28;
/**
* Logger initialization.
* Default baud rate: 115200
* Default log level: LOG_LEVEL_DEBUG
* @note If USB_UART_RX and USB_UART_TX
* are defined as HAL_PIN_NC, you will
* need to define them manually for log to work.
* See @b LOG_MAP_USB_UART macro definition for detailed explanation.
*/
LOG_MAP_USB_UART( log_cfg );
log_init( &logger, &log_cfg );
log_info( &logger, " Application Init " );
// Click initialization.
powermonitor_cfg_setup( &powermonitor_cfg );
POWERMONITOR_MAP_MIKROBUS( powermonitor_cfg, MIKROBUS_1 );
err_t init_flag = powermonitor_init( &powermonitor, &powermonitor_cfg );
if ( I2C_MASTER_ERROR == init_flag )
{
log_error( &logger, " Application Init Error. " );
log_info( &logger, " Please, run program again... " );
for ( ; ; );
}
powermonitor_default_cfg ( &powermonitor );
log_printf( &logger, "----------------------------\r\n" );
Delay_ms ( 100 );
powermonitor_get_id( &powermonitor, &manufacturer_id, &dieid, &rev_id );
log_printf( &logger, " Manufacturer ID : %.2s\r\n", manufacturer_id );
log_printf( &logger, " Stores Device ID : 0x%.3X\r\n", dieid );
log_printf( &logger, " Revision ID : 0x%.1X\r\n", rev_id );
log_printf( &logger, "----------------------------\r\n" );
log_info( &logger, " Application Task " );
log_printf( &logger, "----------------------------\r\n" );
Delay_ms ( 100 );
}
void application_task ( void )
{
static float vshunt, vbus, current, power, energy, temperature;
powermonitor_get_vshunt( &powermonitor, &vshunt );
log_printf( &logger, " Shunt voltage : %.2f mV\r\n", vshunt );
Delay_ms ( 100 );
powermonitor_get_vbus( &powermonitor, &vbus );
log_printf( &logger, " BUS voltage : %.2f mV\r\n", vbus );
Delay_ms ( 100 );
powermonitor_get_current( &powermonitor, ¤t );
log_printf( &logger, " Current : %.2f mA\r\n", current );
Delay_ms ( 100 );
powermonitor_get_power( &powermonitor, &power );
log_printf( &logger, " Power : %.6f W\r\n", power );
Delay_ms ( 100 );
powermonitor_get_energy( &powermonitor, &energy );
log_printf( &logger, " Energy : %.6f J\r\n", energy );
log_printf( &logger, "- - - - - - - - - - - - - - \r\n" );
Delay_ms ( 100 );
powermonitor_get_temperature( &powermonitor, &temperature );
log_printf( &logger, " Temperature : %.2f C\r\n", temperature );
log_printf( &logger, "----------------------------\r\n" );
Delay_ms ( 1000 );
Delay_ms ( 1000 );
}
int main ( void )
{
/* Do not remove this line or clock might not be set correctly. */
#ifdef PREINIT_SUPPORTED
preinit();
#endif
application_init( );
for ( ; ; )
{
application_task( );
}
return 0;
}
// ------------------------------------------------------------------------ END
Additional Support
Resources
Category:Power Switch