Monitor and regulate the performance of various hardware components with LM96080 and PIC32MZ2048EFH100
Your system's guardian

Published Jun 01, 2023
Click board™
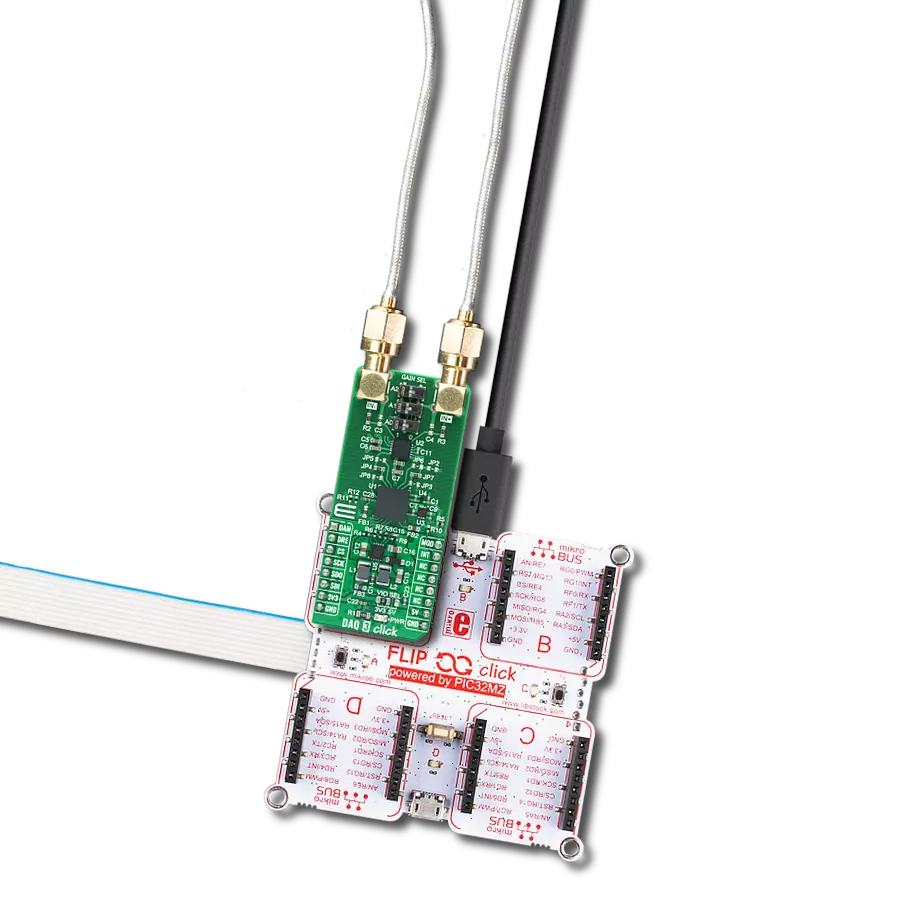
HW Monitor Click
Dev. board
Flip&Click PIC32MZ
Compiler
NECTO Studio
MCU
PIC32MZ2048EFH100
Ensure the stability and performance of your embedded solutions
A
A
Hardware Overview
How does it work?
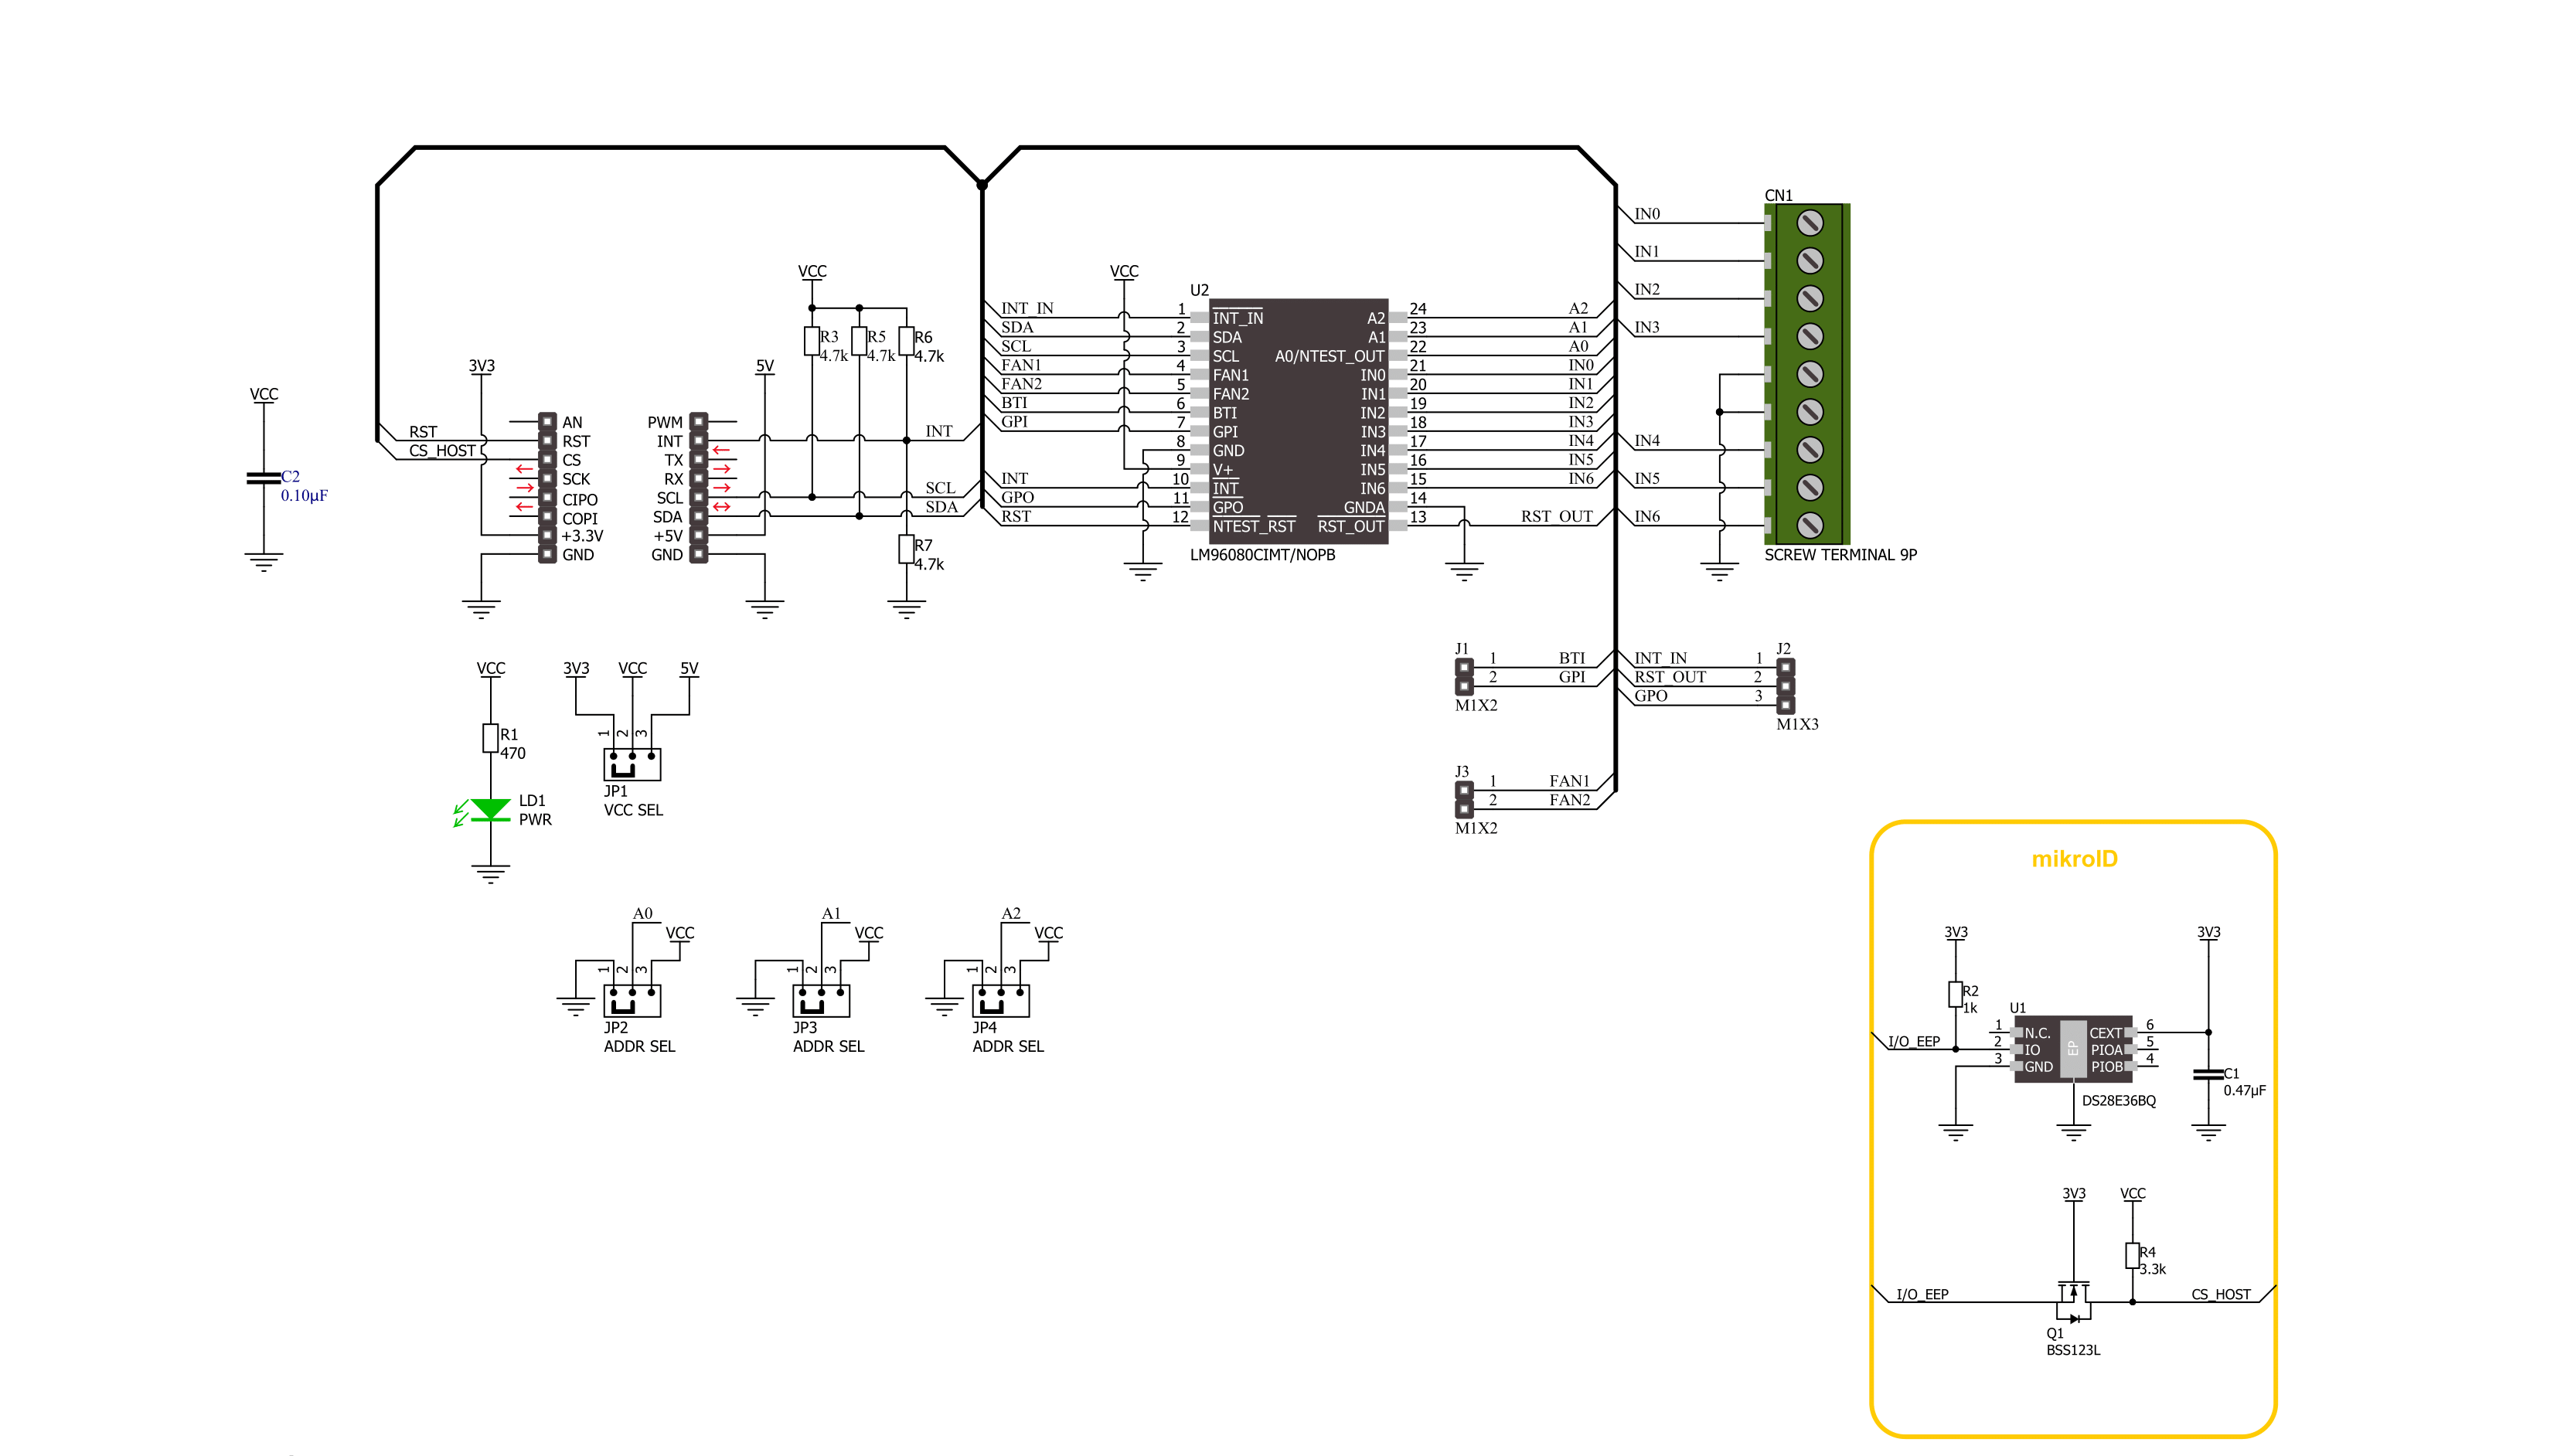
HW Monitor Click is based on the LM96080, a system hardware monitor from Texas Instruments that performs power supply, temperature, and fan monitoring for various embedded systems. The LM96080 provides seven analog inputs spread across the terminals on the top of the board labeled from IN0 to IN6, a temperature sensor, a delta-sigma ADC, two fan speed counters, watchdog registers, and a variety of inputs and outputs on a single chip. It continuously converts analog inputs to 10-bit resolution with a 2.5mV LSB, yielding input ranges of 0 to 2.56V. The analog inputs are intended to be connected to the several power supplies present in a typical communications infrastructure system. This Click board™ communicates with MCU using the standard I2C 2-Wire interface to read data and configure settings with a maximum frequency of 400kHz. The LM96080 includes an analog filter on the I2C lines that improves noise immunity and supports the timeout reset function on SDA and SCL pins, preventing I2C bus lockup. Also, the LM96080 allows choosing the least significant bits (LSB) of its I2C slave address using the SMD jumpers labeled ADDR SEL. The LM96080 is especially suited to interface with linear and digital temperature sensors such as LM73, LM75, LM56, LM57,
LM26, LM27, LM26LV, or other LM96080 via the BTI pin on one of the unpopulated headers. Temperature can be converted to a 9-bit or 12-bit two's complement word with resolutions of 0.5°C or 0.0625°C LSB, respectively. On the same header, in addition to the BTI pin, there is also a GPI pin, which, in addition to its function as a general-purpose input pin, can also serve as a chassis intrusion detection input. The chassis intrusion input is designed to accept an active high signal from an external circuit that latches, such as when the cover is removed from the computer. Next in this board's series of additional features are the fan inputs, labeled FAN1 and FAN2, that can be programmed to accept either fan failure indicator programmed to be active high or active low or tachometer signals. Fan inputs measure the period of tachometer pulses from the fans, providing a higher count for lower fan speeds. The full-scale fan counts are 255 (8-bit counter), representing a stopped or slow fan. Based on a count of 153, nominal speeds are programmable from 1100 to 8800 RPM. Signal conditioning circuitry is also included to accommodate the slow rise and fall times. The last header contains functions such as an external interrupt input INT IN, a master reset for external purposes RST OUT,
and a single power switch pin GPO. The INT IN active low interrupt provides a way to chain the interrupts from other devices through the LM96080 to the host, the RST_OUT is intended to provide a master reset to devices connected to this line, while the GPO pin is an active low NMOS open drain output intended to drive an external power PMOS for software power control or can be utilized to control power to a cooling fan. The LM96080 also possesses a general reset signal routed on the RST pin of the mikroBUS™ socket to reset the LM96080, and an additional interrupt signal, routed on the INT pin of the mikroBUS™ socket whenever some of the external interrupts like INT_OUT, interrupt from the temperature sensor, or when a chassis detection event occurs. This Click board™ can operate with either 3.3V or 5V logic voltage levels selected via the VCC SEL jumper. This way, both 3.3V and 5V capable MCUs can use the communication lines properly. However, the Click board™ comes equipped with a library containing easy-to-use functions and an example code that can be used, as a reference, for further development.

Features overview
Development board
Flip&Click PIC32MZ is a compact development board designed as a complete solution that brings the flexibility of add-on Click boards™ to your favorite microcontroller, making it a perfect starter kit for implementing your ideas. It comes with an onboard 32-bit PIC32MZ microcontroller, the PIC32MZ2048EFH100 from Microchip, four mikroBUS™ sockets for Click board™ connectivity, two USB connectors, LED indicators, buttons, debugger/programmer connectors, and two headers compatible with Arduino-UNO pinout. Thanks to innovative manufacturing technology,
it allows you to build gadgets with unique functionalities and features quickly. Each part of the Flip&Click PIC32MZ development kit contains the components necessary for the most efficient operation of the same board. In addition, there is the possibility of choosing the Flip&Click PIC32MZ programming method, using the chipKIT bootloader (Arduino-style development environment) or our USB HID bootloader using mikroC, mikroBasic, and mikroPascal for PIC32. This kit includes a clean and regulated power supply block through the USB Type-C (USB-C) connector. All communication
methods that mikroBUS™ itself supports are on this board, including the well-established mikroBUS™ socket, user-configurable buttons, and LED indicators. Flip&Click PIC32MZ development kit allows you to create a new application in minutes. Natively supported by Mikroe software tools, it covers many aspects of prototyping thanks to a considerable number of different Click boards™ (over a thousand boards), the number of which is growing every day.

Microcontroller Overview
MCU Card / MCU
Architecture
PIC32
MCU Memory (KB)
2048
Silicon Vendor
Microchip
Pin count
100
RAM (Bytes)
524288
Used MCU Pins
mikroBUS™ mapper
Take a closer look
Click board™ Schematic
Step by step
Project assembly

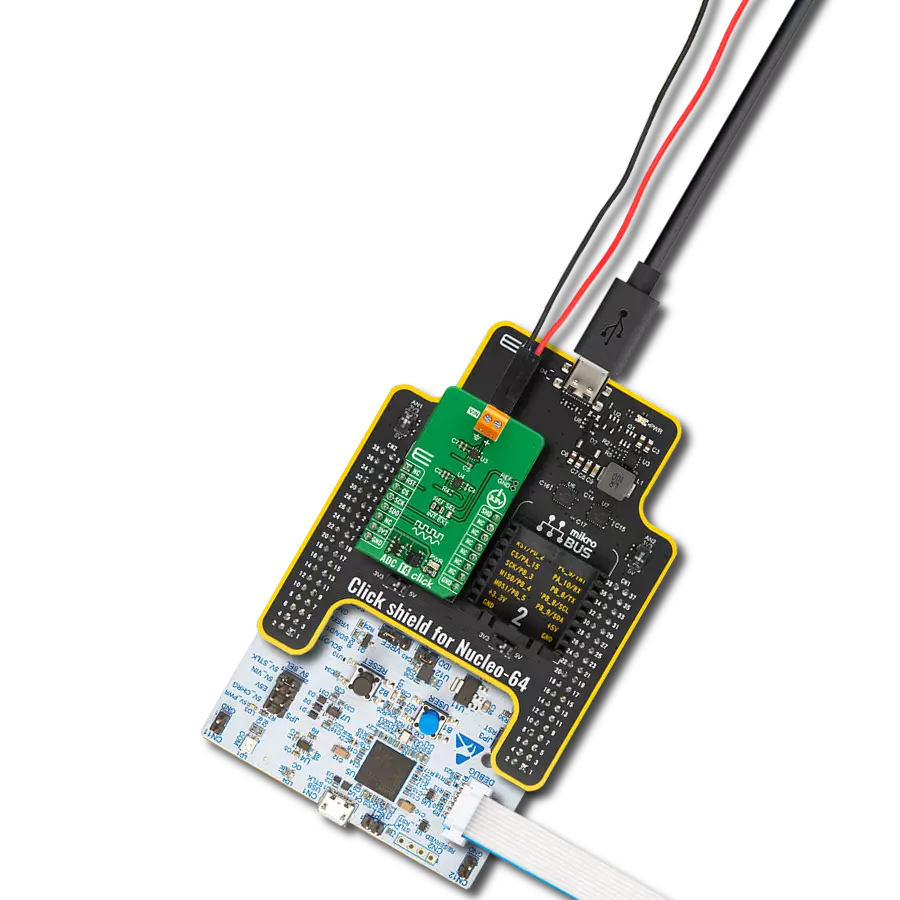
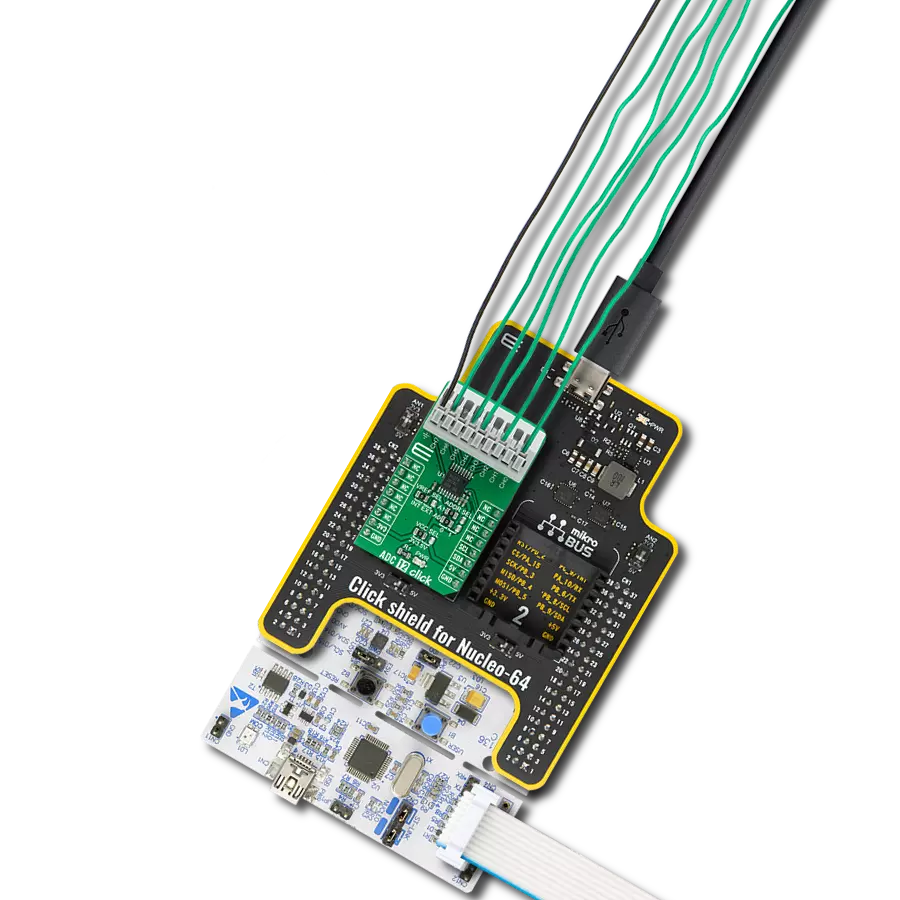
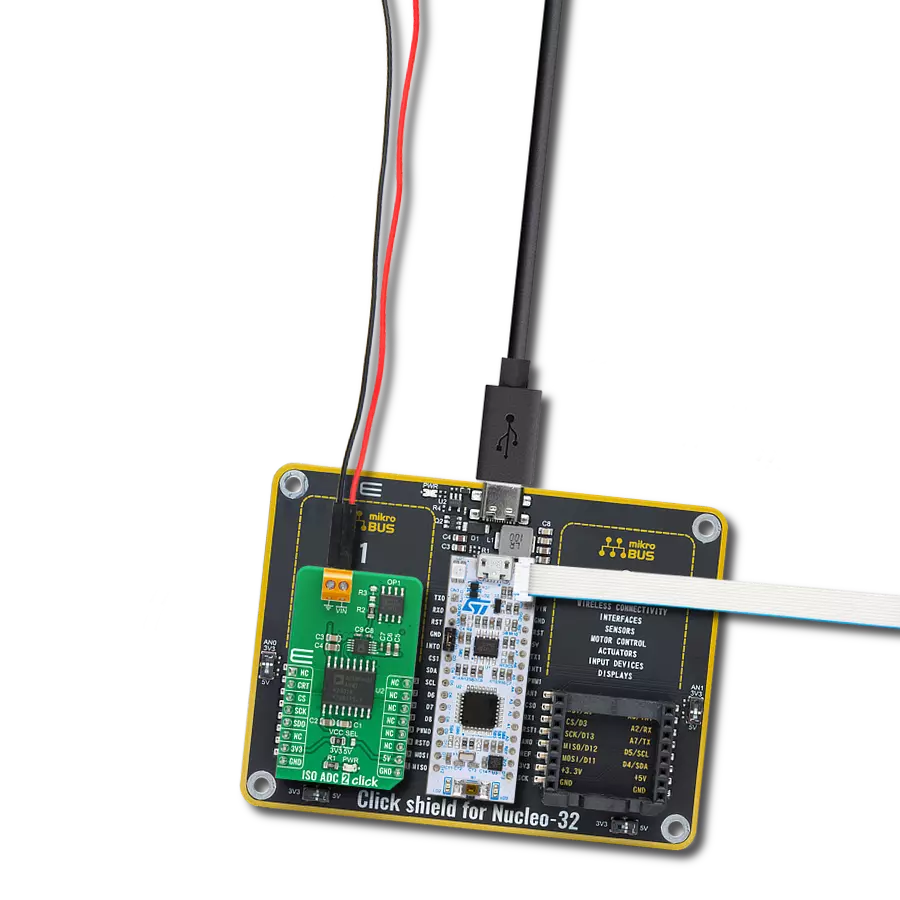
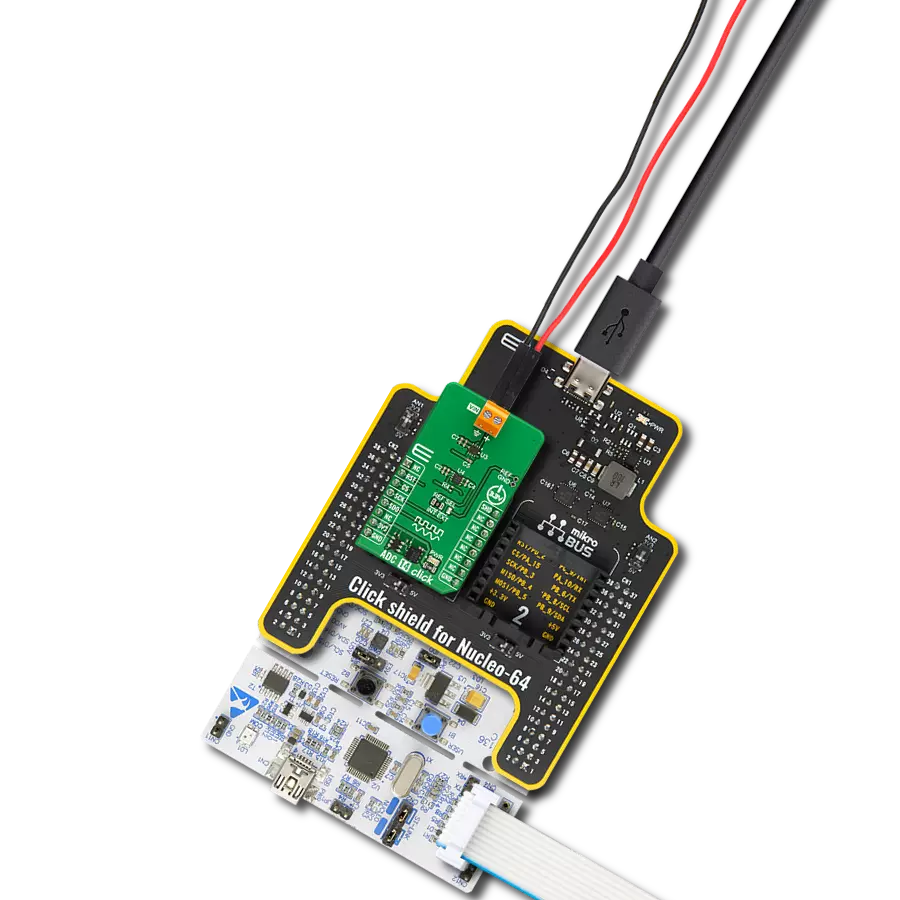
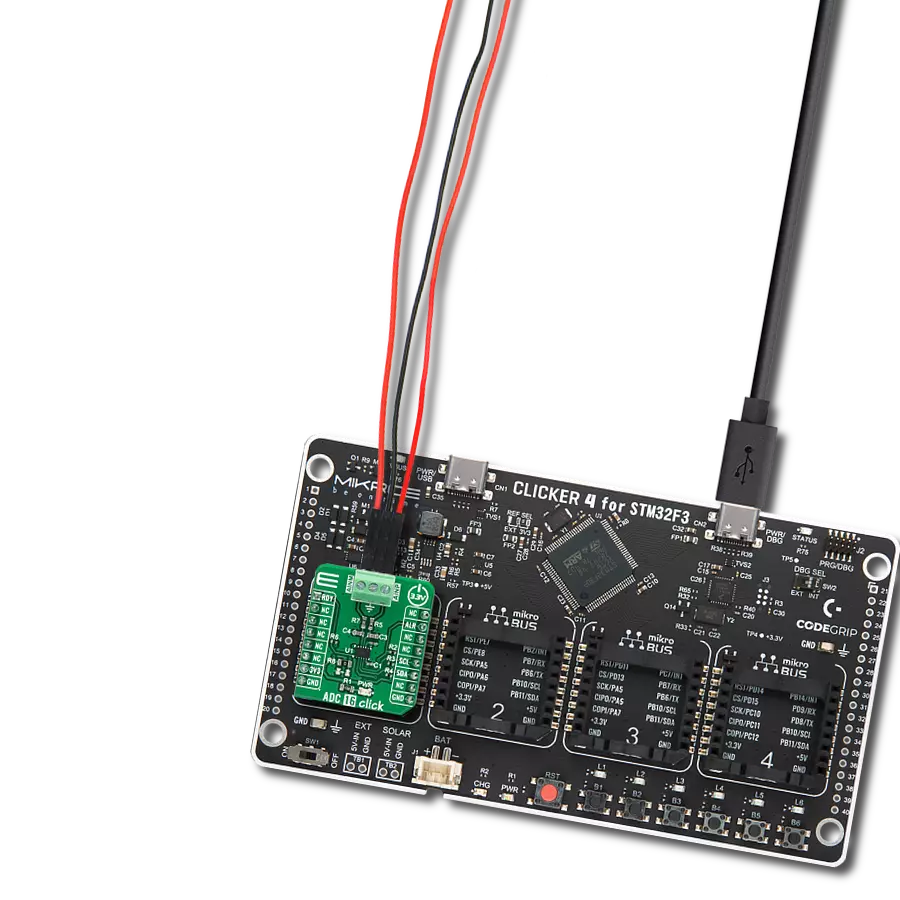
Start by selecting your development board and Click board™. Begin with the Flip&Click PIC32MZ as your development board.


Software Support
Library Description
This library contains API for HW Monitor Click driver.
Key functions:
hwmonitor_get_analog_inputsHW Monitor gets analog inputs voltage function.hwmonitor_get_temperatureHW Monitor gets temperature function.hwmonitor_set_configHW Monitor set the configuration function.
Open Source
Code example
The complete application code and a ready-to-use project are available through the NECTO Studio Package Manager for direct installation in the NECTO Studio. The application code can also be found on the MIKROE GitHub account.
/*!
 * @file main.c
 * @brief HW Monitor Click example
 *
 * # Description
 * This example demonstrates the use of the HW Monitor Click board™.
 * The demo application monitors analog voltage inputs and local temperature data.
 *
 * The demo application is composed of two sections :
 *
 * ## Application Init
 * The initialization of the I2C module, log UART and additional pins.
 * After the driver init, the app executes a default configuration.
 *
 * ## Application Task
 * This example displays the Analog Voltage Inputs (IN0-IN6) [mV]
 * and Temperature [degree Celsius] data.
 * Results are being sent to the UART Terminal, where you can track their changes.
 *
 * @author Nenad Filipovic
 *
 */

#include "board.h"
#include "log.h"
#include "hwmonitor.h"

static hwmonitor_t hwmonitor;
static log_t logger;

void application_init ( void )
{
    log_cfg_t log_cfg;  /**< Logger config object. */
    hwmonitor_cfg_t hwmonitor_cfg;  /**< Click config object. */

    /**
     * Logger initialization.
     * Default baud rate: 115200
     * Default log level: LOG_LEVEL_DEBUG
     * @note If USB_UART_RX and USB_UART_TX
     * are defined as HAL_PIN_NC, you will
     * need to define them manually for log to work.
     * See @b LOG_MAP_USB_UART macro definition for detailed explanation.
     */
    LOG_MAP_USB_UART( log_cfg );
    log_init( &logger, &log_cfg );
    log_info( &logger, " Application Init " );

    // Click initialization.
    hwmonitor_cfg_setup( &hwmonitor_cfg );
    HWMONITOR_MAP_MIKROBUS( hwmonitor_cfg, MIKROBUS_1 );
    if ( I2C_MASTER_ERROR == hwmonitor_init( &hwmonitor, &hwmonitor_cfg ) )
    {
        log_error( &logger, " Communication init." );
        for ( ; ; );
    }

    if ( HWMONITOR_ERROR == hwmonitor_default_cfg ( &hwmonitor ) )
    {
        log_error( &logger, " Default configuration." );
        for ( ; ; );
    }

    log_info( &logger, " Application Task " );
    log_printf( &logger, "--------------------------\r\n" );
    Delay_ms ( 1000 );
}

void application_task ( void )
{
    static float temperature, voltage;
    for ( uint8_t in_pos = 0; in_pos < 7; in_pos++ )
    {
        if ( HWMONITOR_OK == hwmonitor_get_analog_inputs( &hwmonitor, in_pos, &voltage ) )
        {
            log_printf( &logger, "IN %d: %.1f mV\r\n", ( uint16_t ) in_pos, voltage );
            Delay_ms ( 100 );
        }
    }
    log_printf( &logger, "- - - - - - - - - - - - - -\r\n" );
    if ( HWMONITOR_OK == hwmonitor_get_temperature ( &hwmonitor, &temperature ) )
    {
        log_printf( &logger, " Temperature: %.3f [deg c]\r\n", temperature );
        Delay_ms ( 100 );
    }
    log_printf( &logger, "--------------------------\r\n" );
    Delay_ms ( 1000 );
}

int main ( void )
{
    /* Do not remove this line or clock might not be set correctly. */
    #ifdef PREINIT_SUPPORTED
    preinit();
    #endif

    application_init( );

    for ( ; ; )
    {
        application_task( );
    }

    return 0;
}

// ------------------------------------------------------------------------ END
Additional Support
Resources
Category:ADC